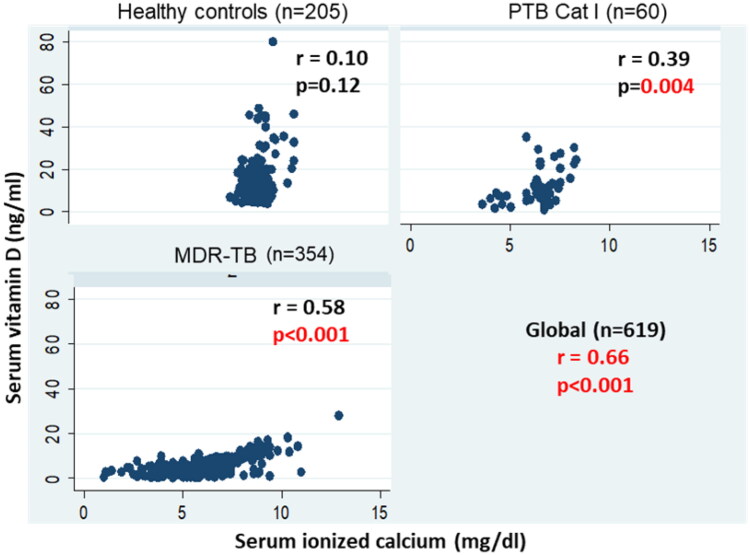
Figure 4.
Correlation between serum vitamin D and ionized calcium levels in MDR-TB, PTB cat I patients and healthy controls. A scatter plot is shown between serum ionized calcium (mg/dl) in the X-axis and serum vitamin D levels (ng/ml)) in the Y-axis with correlation coefficient (r) and significance of correlation (p).

