Abstract
Defining the molecules that regulate tumor cell survival is an essential prerequisite for the development of targeted approaches to cancer treatment. Whereas many studies aimed at identifying such targets use human tumor cells grown in vitro or as s.c. xenografts, it is unclear whether such experimental models replicate the phenotype of the in situ tumor cell. To begin addressing this issue, we have used microarray analysis to define the gene expression profile of two human glioma cell lines (U251 and U87) when grown in vitro and in vivo as s.c. or as intracerebral (i.c.) xenografts. For each cell line, the gene expression profile generated from tissue culture was significantly different from that generated from the s.c. tumor, which was significantly different from those grown i.c. The disparity between the i.c gene expression profiles and those generated from s.c. xenografts suggests that whereas an in vivo growth environment modulates gene expression, orthotopic growth conditions induce a different set of modifications. In this study the U251 and U87 gene expression profiles generated under the three growth conditions were also compared. As expected, the profiles of the two glioma cell lines were significantly different when grown as monolayer cultures. However, the glioma cell lines had similar gene expression profiles when grown i.c. These results suggest that tumor cell gene expression, and thus phenotype, as defined in vitro is affected not only by in vivo growth but also by orthotopic growth, which may have implications regarding the identification of relevant targets for cancer therapy.
Keywords: microarray, intracerebral, brain tumor
Investigations aimed at developing anticancer agents have begun to shift away from general cytotoxic drugs to those that target specific molecules or processes selectively involved in tumor cell survival. The advantages of targeted therapy include reduced normal tissue toxicity and the availability of molecular markers that serve as indicators of drug action. The improved survival of chronic myelogenous leukemia patients treated with Gleevec is often cited as an example of the success that can be achieved with a molecular target-oriented approach (1). In contrast to hematopoietic cancers, the use of target-directed therapy against the majority of solid tumors has met with considerably less success. This lack of success can be attributed to a number of potential obstacles, including intratumor and intertumor cell heterogeneity and the existence of multiple and/or redundant survival pathways. Thus, it would appear that the further development of target-based approaches to treat solid tumors will require a better understanding of the genetic and epigenetic circumstances that not only dictate the expression of a putative target, but also its impact on tumor cell survival.
Investigations into the biology of solid tumor cells often use cell lines grown and maintained as monolayer cultures. Such experimental systems have provided a wealth of information pertaining to the critical molecules and pathways mediating tumor survival and response to therapy. Clearly, in vitro cultures have served as an essential experimental system for cancer drug development and have proven invaluable in identifying cytotoxic agents (2, 3). However, a critical assumption in the use of monolayer cultures is that tumor cells in vitro simulate the phenotype of tumor cells in situ. Although this may be the case in general terms, whether cells grown in vitro recreate the complex signaling processes and survival pathways existing in vivo is subject to question. Thus, it would appear that directly comparing the phenotypes for tumor cells grown under in vitro and in vivo growth conditions would generate a better understanding of the appropriate models for investigations of cancer cell biology and experimental therapies.
Toward this end, we have focused on glioblastoma cell lines. Of solid tumors, glioblastomas have been and continue to be among the most resistant to therapy. However, when human glioma cell lines are evaluated in monolayer culture, their chemosensitivities and radiosensitivities are not significantly different from cell lines originating from other histologies that typically respond to treatment (3). Such observations suggest that brain tumor cells that grow in vitro have undergone a selection process away from their in vivo counterparts and/or that the growth environment (i.e., tissue culture plastic versus in vivo) plays a significant role in regulating cell phenotype. Moreover, regarding the development of targeted therapy, these data then suggest that the molecules that regulate glioma cell response in monolayer culture may not be the same as those for glioma cells existing in vivo. Whereas the role of in vitro selection pressure is difficult to assess, it is possible to evaluate the contribution of the growth environment in determining tumor cell phenotype. Therefore, we have used gene expression profiles generated from microarray analysis to compare the phenotypes of two human glioma cell lines grown as in vitro monolayer cultures, as s.c. leg tumor xenografts and intracerebral (i.c.) xenograft tumors. The data indicate that the gene expression profiles of glioma cells grown in vitro, s.c., and i.c. are significantly different. However, surprisingly, the data also indicate that although the two glioma lines have disparate gene expression profiles when evaluated in vitro or as s.c. tumors, under orthotopic i.c. conditions their profiles are very similar.
Materials and Methods
Cell Lines and Treatment. The human glioma cell lines U251 and U87 (American Type Culture Collection) were used in this study. Each cell line was grown in RPMI medium 1640 (Life Technologies, Rockville, MD) containing glutamate (5 mM) and 5% FBS and maintained at 37°C in an atmosphere of 5% CO2 and 95% room air.
In Vivo Tumor Models. Male, 4- to 6-week-old severe combined immunodeficient (SCID) and nude mice were used in these studies. Mice were caged in groups of five or less, and all animals were fed a diet of animal chow and water ad libitum. Tumor cells (5 × 10⁶ cells) were injected s.c. into the right hind leg or i.c. as described (4). Subcutaneous tumors were harvested when they reached 500 mm3, and i.c. tumors were harvested at 13.5 mm3, at which time the animals were symptomatic. All animal studies were conducted in accordance with the principles and procedures outlined in the National Institute of Health Guide for the Care and Use of Animals on approved studies from the National Institutes of Health Institutional Animal Care and Use Committee.
RNA Sample Preparation and Probes Labeling. Cells were scraped from tissue culture flasks or a single cell suspension of tumor cells in 0.9% normal saline was generated by passing pieces of viable tumor through a sieve and then through a series of sequentially smaller hypodermic needles (22-30 gauge) as reported (4). Total RNA was extracted from each sample by using TRIZOL reagent (Invitrogen) passed through an RNeasy spin column (Qiagen, Valencia, CA) and then amplified by using RiboAmp RNA Kits (Arcturus Engineering, Mountain View, CA) according to the manufacturer's protocol. Amplified RNA (1.5-3.0 μg) was labeled with Cy5-dUTP (experimental RNA) or Cy3-dUTP (Stratagene) by using Superscript II Reverse Transcriptase (Invitrogen).
Microarray Procedure. Each cDNA microarray chip contained 7,680 human cDNA clones (National Cancer Institute Radiation Oncology Sciences Program 8K Human Array), and methods for microarray hybridization and washing have been described (5). Test sample RNAs from all site-specific tumors or in vitro cells were competitively hybridized with the universal reference RNA mentioned above. Hybridized arrays were scanned with 10-μm resolution on a GenePix 4000A scanner (Axon Instruments, Foster City, CA) at wavelengths 635 and 532 nm for Cy5- and Cy3-labeled probes, respectively. The resulting TIFF images were analyzed by genepix pro 4.0 software (Axon Instruments). The ratios of the sample intensity to the reference [red (Cy5)/green (Cy3)] intensity for all targets were determined, and ratio normalization was performed to normalize the center of ratio distribution to 1.0. All samples had a biological replicate, and each replicate was run on duplicate slides.
Data Analysis. Raw intensity profiles were analyzed by using the madb tools (National Center for Biotechnology Information, National Institutes of Health) to perform microarray normalization and statistical analysis. All nonflagged raw fluorescent intensities were subjected to a spot quality filter with signal: background ratios >2, a minimum background corrected signal of 250 counts, and 60% of pixels in the spots with an intensity greater than a SD plus background. Principal component analysis (PCA) and scatter plots were created and correlation coefficients were calculated by using madb software (http://nciarray.nci.nih.gov).
Gene Expression Dynamics Inspector (gedi) (www.chip.org/~ge/gedihome.html), a Matlab (Mathworks, Natick, MA) freeware program, uses self-organizing maps (SOMs) to translate high-dimensional data into a 2D mosaic (6). Each tile of the mosaic represents an individual SOM cluster and is color-coded to represent overexpression or underexpression of the cluster's genes, thus identifying the underlying gene pattern. Multiple samples can be evaluated together, thus linking their overall SOM pattern.
A supervised approach to analyzing the individual genes by using significance analysis of microarrays (sam) was performed (www-stat.stanford.edu/tibs/SAM). The sam algorithm identifies statistically significant genes by performing a set of gene-specific t tests scored against the standard deviation of the entire gene expression data set and identifies a false detection rate by repeated permutations of the data set (7). This data set was analyzed by using a two-class unpaired analysis, and the delta values were adjusted to obtain the largest gene list that gave a false discovery rate of <5% (8).
A supervised approach to analyzing the function of individual genes by using gostat was performed (http://gostat.wehi.edu.au). This program automatically obtains the gene ontology (GO) annotations from a database and generates a statistical analysis of the functional annotations that are overrepresented in the inputted list of genes (9).
Results
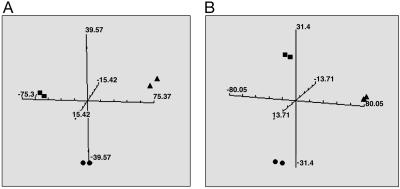
The aim of this investigation was to determine the influence of growth environment on the gene expression profiles of two human glioma cell lines. As an initial study, microarray-based gene expression profiles were generated for U251 glioma cells grown as an in vitro monolayer culture and as xenografts at two sites in SCID mice: s.c. in the hind leg and i.c. The s.c. group was intended to simulate a standard experimental model for evaluating in vivo therapeutic response and the i.c. group represents an orthotopic model. Expression profiles were generated for independent biological replicates of each of the growth conditions. As an initial assessment of the patterns of U251 gene expression in the three model systems, PCA was applied. This unsupervised method allows for the comparison of complex data sets in a 3D graph (10). As shown in Fig. 1A, PCA indicated consistent expression patterns among the replicate samples for each growth condition. However, there were clearly different expression profiles generated for cells in culture as compared with those grown in vivo either as s.c. leg or orthotopic i.c. xenografts. Moreover, there were definitive differences between the expression profiles obtained from s.c. versus i.c. xenografts. Thus, these studies indicate that U251 gene expression depends on growth conditions with the two most frequently used in an experimental setting (monolayer culture and s.c.) being different from that obtained under orthotopic growth conditions (i.c.).
Fig. 1.
PCA for U251 cells grown in vitro and in vivo as s.c. and i.c. tumors. Gene expression profiles were generated for each growth condition in SCID (A) or nude (B) mice, and the principal components were calculated and plotted. Each plot is representative of two independent experiments with the duplicate symbols indicating the biological replicates. ▪ correspond to tissue culture, • correspond to s.c. tumors, and ▴ correspond to i.c. tumors.
To determine whether the effects of in vivo growth on U251 gene expression could be attributed to the potentially unique environment of the SCID mouse, the same experiments were performed on U251 cells growing as xenografts in the leg (s.c.) and brain (i.c.) of nude mice. The gene expression profiles generated from U251 cells derived from s.c. tumors and i.c. tumors in nude mice were compared with the profiles obtained from monolayer cultures with PCA (Fig. 1B). As in the SCID mouse model, U251 gene expression when grown in nude mice was significantly different from the profile generated from in vitro culture with the profiles generated from s.c. xenografts mapping into a different PCA quadrant than the profiles from the i.c. xenografts. It should be noted that the same in vitro data sets were used to generate the PCA for Fig. 1; the different locations in A and B arise because of their respective comparisons within each mouse strain. These results indicate that the effects of the in vivo environment on U251 gene expression were not specific to the SCID mouse strain.
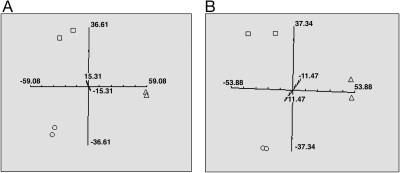
The effects of experimental growth conditions on gene expression were then evaluated in an additional human glioma cell line, U87, which has been frequently used in experimental studies. These studies followed the same protocol as described above. U87 gene expression profiles were generated from in vitro cultures and in vivo s.c. and i.c. xenografts grown in SCID and nude mice; the profiles were then compared by using PCA. The gene expression profiles of U87 cells differed between in vitro and in vivo growth conditions, as did the profiles generated from s.c. and i.c. xenograft sites (Fig. 2). Thus, U87 cell gene expression depended on growth condition in a manner similar to that detected for U251 cells.
Fig. 2.
PCA for U87 cells grown in vitro and in vivo as s.c. and i.c. tumors. Gene expression profiles were generated for each growth condition in SCID (A) or nude (B) mice, and the principal components were calculated and plotted. Each plot is representative of two independent experiments with the duplicate symbols indicating the biological replicates. □ correspond to tissue culture, ○ correspond to s.c. tumors, and ▵ correspond to i.c. tumors.
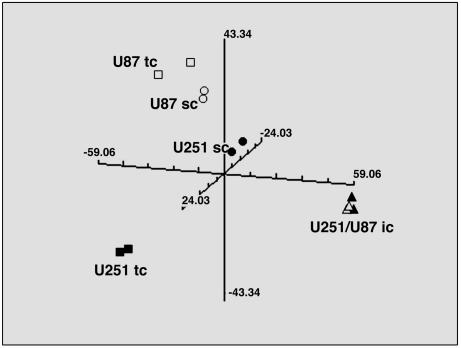
Although both originated from glioblastomas, the U251 and U87 cell lines are clearly not isogenic (e.g., U251 contains mutant p53 and U87 contains WT p53) and, consequently, would be expected to have disparate gene expression patterns. To directly compare U251 and U87 gene expression under the three growth conditions, each cell line was combined into a single data set and the PCA was recalculated. As shown in Fig. 3, when the cell lines were evaluated as in vitro cultures, the expected distinct patterns were obtained. However, in both mouse models, the gene expression patterns obtained for U251 and U87 cells grown as s.c. xenografts were less dissimilar as compared with their in vitro profiles. Moreover, the PCA results from U251 and U87 cells grown under the orthotopic i.c. conditions overlapped in each of the mouse model systems.
Fig. 3.
PCA comparing U251 and U87 cells grown in vitro (tissue culture, tc) and in vivo as s.c. and i.c. tumors in SCID mice. Gene expression profiles were generated for each growth condition, and the components were calculated and plotted. Each plot is representative of two independent experiments with the duplicate symbols indicating the biological replicates. For U251 cells, ▪ correspond to tissue culture, • correspond to s.c. tumors, and ▴ correspond to i.c. tumors. For U87 cells, □ correspond to monolayer culture, ○ correspond to s.c. tumors, and ▵ correspond to i.c. tumors.
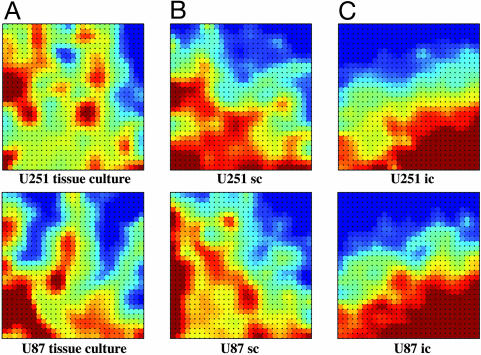
As an additional method for comparing gene expression profiles, gedi was applied to the U251 and U87 cells grown under the three experimental conditions. gedi uses self-organizing maps to express complex data sets as interactive mosaic images. Each mosaic tile represents a group of genes that are expressed at similar levels, which, in turn, are similar in expression to the surrounding mosaic tiles. A color gradient is applied to represent the outlier gene patterns with maroon indicating the highest level of gene expression, yellow indicating an intermediate level of gene expression, and blue corresponding to the lowest level of gene expression as compared with the universal reference. Comparing the cell lines grown under in vitro conditions reveals a disparate pattern of gene expression (Fig. 4A). Consistent with PCA, the difference between U251 and U87 gene expression was reduced when the cells were grown s.c. (Fig. 4B), and even further reduced when grown orthotopically (Fig. 4C). Whereas these images were generated from xenografts grown in SCID mice, similar results were obtained by using samples from the nude mouse model (data not shown). Thus, as for PCA, the dimensional reduction method of gedi indicates that the disparity between the gene expression profiles of U251 and U87 cells when grown on plastic was reduced when the cells were grown as orthotopic xenografts.
Fig. 4.
Comparison of U251 and U87 cell gene expression when grown in vitro and in vivo as s.c. and i.c. tumors in SCID mice by using gedi analysis. Gene expression profiles generated for U251 and U87 cells grown in tissue culture (A), as s.c. xenografts (B), and as i.c. xenografts (C) were subjected to gedi analysis. Genes with similar expression levels were grouped within the same tile; the maroon tiles correspond to highly expressed genes, yellow tiles correspond to genes with intermediate expression, and dark blue tiles correspond to genes with the lowest expression.
Because PCA, and to a lesser extent, gedi results can be overly influenced by a few outlier genes, scatter grams were used to directly compare the expression level of individual genes in the U251 and U87 cells. For each growth condition the gene expression profile of U251 cells was plotted against the corresponding profile of U87 cells (Fig. 5). Points falling on the solid line in Fig. 5 correspond to genes with similar expression levels in the two cell lines, whereas those outside the dotted line differed by 2-fold or more. As an indicator of similarity of the gene expression profiles, correlation coefficients were calculated. As shown in Fig. 5A, the gene expression profiles for U251 and U87 cells grown in vitro were substantially different, which was reflected by the scatter around the origin and the low correlation coefficient. Comparison of the cell lines when grown under s.c. conditions (Fig. 5B) revealed less scatter and a higher correlation coefficient, suggestive of more similar gene expression profiles than detected in the analysis of cells grown in vitro. Finally, comparison of U251 and U87 cells grown i.c. showed little scatter around the origin, with the high correlation coefficient of 0.957 indicative of similar gene expression profiles (Fig. 5C). These results are thus consistent with the PCA and gedi results shown above and indicate that the disparity in gene expression profiles for the two cell lines when grown in vitro were reduced by growth s.c. with growth under orthotopic conditions eliminating the majority of the differences.
Fig. 5.
Scatter plots comparing U251 and U87 gene expression for cells grown in vitro and in vivo as s.c. and i.c. tumors in SCID mice. U251 gene expression and U87 gene expression were directly compared by using scatter blot analysis for tissue culture (A) and s.c. (B) and i.c. (C) growth conditions. Correlation coefficients were calculated for each comparison and are listed in each scatter plot. Points outside the dotted line represent genes with expression levels that differ by >2-fold between the cell lines. Each plot is representative of at least four individual comparisons.
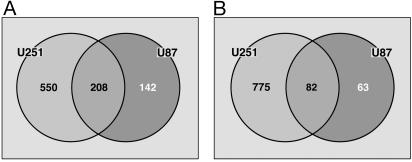
As a statistical method for identifying the specific genes affected by the three growth conditions, sam was applied. In an initial analysis sam was used to identify the genes whose expression was significantly different between monolayer culture and i.c. growth conditions. Compared with the gene expression profile of monolayer culture U251 cells, the expression of 1,615 genes was modulated by i.c. growth, 758 increased and 857 decreased (Fig. 6). In U87 cells 495 genes were affected by i.c. growth as compared with monolayer culture conditions with 350 increased and 145 decreased (Fig. 6). Reflecting the convergence of the gene expression profiles for U251 and U87 when grown i.c., 290 genes were found to be similarly affected in both cell lines (208 with increased and 82 with decreased expression), 275 of which were unique. The genes affected by orthotopic growth in both U251 and U87 cells are listed in Tables 1 and 2, which are published as supporting information on the PNAS web site.
Fig. 6.
Identification of genes affected in both U251 and U87 cells under i.c. versus monolayer growth conditions. sam was used to identify the genes in each cell line that were overexpressed (A) and underexpressed (B) in i.c. tumors in SCID mice as compared with their respective tissue cultures. Genes exclusive to U251 cells (Left) and genes exclusive to U87 cells (Right) are shown. The overlapping center portions indicate genes common to both cell lines.
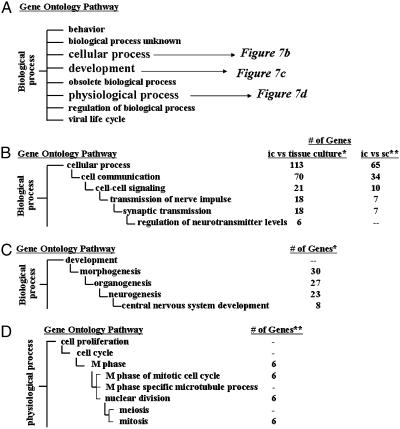
To determine whether the 290 common genes affected by i.c. growth correspond to specific biological/biochemical processes, the pathway analysis tool gostat was applied (9). gostat distributes genes into biological/biochemical processes that are organized according to GO pathways, which are linked in hierarchical clusters with the most general function at the primary node and more specific functions at each subsequent node. The number of genes expected to occur randomly in each pathway is then compared with the actual distribution of genes in the sample set, which results in a list of biological/biochemical pathways that are statistically overrepresented in a given list of genes. As shown in Fig. 7A, the general GO category of biological process is comprised of eight more specific processes/functions; the genes overrepresented in i.c. tumors distributed to cellular process and development (Fig. 7 B and C), and the genes overrepresented in monolayer cultures distributed to physiological process (Fig. 7D). For the 208 genes with an increased expression under i.c. growth conditions, 113 were found in six sequential paths of increasing functional specificity from cellular process (113 genes) to regulation of neurotransmitter levels (six genes) (Fig. 7B). A second set of four sequential paths in the GO annotation hierarchy beginning at morphogenesis (30 genes) and continuing to the more specific, CNS development (eight genes), were also overrepresented (Fig. 7C). As there are >4,000 GO pathway annotations representing diverse biological processes, the fact that the above pathways were each significantly (P < 0.001) overrepresented suggests that the gene expression changes induced by i.c. growth were not random, but related to cell function or phenotype. Thus, these data suggest that growth of the U251 and U87 cell lines as i.c. tumors results in a gene expression profile that is more related to CNS function and development than the profile from the cells grown in vitro. On the other hand, the 82 genes with decreased expression under i.c. growth conditions were not statistically overrepresented in pathways related to CNS function or development (Fig. 7D). They were distributed in pathways associated with cell proliferation including M phase of mitotic cell cycle, nuclear division, and mitosis (six genes each).
Fig. 7.
Biological/biochemical functions of the genes commonly affected in U251 and U87 cells by i.c. growth. The genes identified by sam as being modulated by i.c. growth in SCID mice in both the glioma cells lines as compared with tissue culture and s.c. growth conditions were subjected to gostat analysis for determination of specific functions. (A) The GO pathways existing under biological processes with those overrepresented or underrepresented in the i.c. tumors indicated. (B) Pathways under cellular processes overrepresented in the i.c. tumors versus tissue culture and s.c. tumors. (C) Pathways under development overrepresented in the i.c. tumors versus tissue culture. (D) Pathways under physiological process underrepresented in the i.c. tumors versus tissue culture. The numbers of genes distributed to each pathway are listed to the right of each pathway. The statistical significance of each distribution is denoted by * for P < 0.001 and ** for P < 0.01.
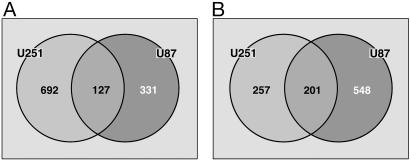
A goal of this study was to determine whether glioma cell gene expression under orthotopic growth conditions differed from the two most frequently used experimental models, in vitro culture and s.c. xenografts. Therefore, the above analysis (sam) was applied to the comparison of i.c. to s.c. tumors (Fig. 8). As compared with s.c. U251 tumors, 1,277 genes were identified as significantly affected by i.c. growth, 819 increased and 458 decreased (Fig. 8). In U87 cells (Fig. 8) 1,207 genes were affected by i.c. growth as compared with s.c. conditions with 458 increased and 749 decreased. When comparing these two gene lists, 328 genes were found to be similarly affected in both cell lines (127 with increased and 201 with decreased expression).
Fig. 8.
Identification of genes affected in both U251 and U87 cells under i.c. versus s.c. growth conditions. sam was used to identify the genes in each cell line that were overexpressed (A) and underexpressed (B) in i.c. tumors as compared with their respective s.c. tumors in SCID mice. Genes exclusive to U251 cells (Left) and genes exclusive to U87 cells (Right) are shown. The overlapping center portions indicate genes common to both cell lines.
According to gostat analysis the 127 genes with an increased expression under i.c. as compared with s.c. growth conditions were overrepresented in the same sequential pathway (cellular process), as for i.c. versus monolayer culture excluding regulation of neurotransmitter levels (Fig. 7B). Under the pathway development, only organogenesis was significantly overrepresented (14 genes and P < 0.001, data not shown) in the i.c. versus s.c. comparison. However, the genes with reduced expression i.c. as compared with s.c. (201 genes) were distributed into two nonsequential pathways, cytoplasm and protein binding (data not shown), which did not appear in the i.c. versus monolayer culture comparison. These analyses indicate that the gene expression profile of cells grown i.c. was also significantly different from the profile of cells grown s.c. with the i.c. grown cells expressing more genes related to CNS function and development.
Discussion
Recent approaches to cancer therapy have focused on the development and application of molecularly targeted agents. In contrast to the use of traditional cytotoxic agents, however, such an approach requires a thorough understanding of tumor cell biology, particularly the survival and resistance pathways. The vast majority of information pertaining to the molecules and pathways mediating tumor cell survival and therapeutic response has been generated from in vitro monolayer cultures (2, 3). The use of this model system is based on the assumption that the operative survival and resistance mechanisms of a tumor cell in vitro simulate those in situ, which given the vastly different environmental situations may not always be accurate. In an attempt to reduce the potential artifactual influences of in vitro growth on tumor phenotype, investigations have also been performed by using human tumor cells grown as s.c. xenografts in immunocompromised mice (11, 12). However, whereas s.c. growth is an in vivo condition, it may not simulate an orthotopic environment. With respect to orthotopic sites, the brain clearly provides a unique environment as compared with a s.c. setting. Whether the phenotype of a glioma cell as defined in vitro is modulated by s.c. or i.c. environments, to our knowledge, has not been definitively addressed. Therefore, because understanding how a model system affects tumor cell biology is likely to be a critical variable in defining potential therapeutic targets, we have compared the gene expression profiles of two glioma cell lines grown under in vitro, s.c., and i.c. conditions.
The data presented here indicate that the gene expression profiles of U251 and U87 glioma cell lines differ significantly between the in vitro and s.c. in vivo models. These results are consistent with a recent report by Gieseg et al. (13) in their comparison of gene expression in human breast and colon cancer cell lines grown in tissue culture and as s.c. xenografts. The gene expression profiles of the glioma cell lines, however, were also dramatically different between the s.c. and orthotopic in vivo growth conditions. Thus, distinct gene expression profiles were obtained for each of the three experimental growth conditions; by inference, this finding suggests that the glioma cell phenotype varies as a function of the model system. Moreover, the disparity between the i.c. gene expression profiles and those generated from the s.c. xenografts suggests that it is the site of implantation and not in vivo implantation itself that modulates gene expression. Clearly, at this point it is not possible to definitively conclude which of the experimental models is the most appropriate for investigations aimed at identifying potential therapeutic targets. However, it should be noted that the glioma cells grown i.c. expressed significantly more genes related to CNS function and significantly fewer genes related to cell cycle progression and regulation than the cells grown in vitro (Fig. 7). Thus, if the orthotopic model better recapitulates the human treatment situation, these data would suggest that the general approach of targeting cell cycle-associated genes or gene products developed from in vitro models may not be an effective therapeutic strategy for glioma cells in situ.
Given the differences between the model systems with respect to such parameters as 3D cell contact, oxygen levels, and growth factor/cytokine/chemokine availability, disparate gene expression profiles might be expected. However, when U251 cell gene expression was directly compared with that of U87 cells unexpected results were obtained. Whereas distinct profiles were obtained in the in vitro model consistent with the nonisogenic relationship of the two cell lines, when cells were grown s.c. the profiles were less dissimilar and when grown i.c the profiles were actually quite similar. The similarity between U251 and U87 gene expression when grown i.c. was revealed by scatter grams, and the statistical identification of the similarly expressed genes was done by using gedi and sam. For each cell line, a notable difference between i.c. and in vitro growth conditions was the expression of genes related to CNS development and function under i.c. conditions. Comparison of i.c. to s.c. models also revealed that the i.c. tumors expressed more genes related to CNS function. These data suggest that the normal brain environment has a profound effect on glioma cell gene expression. Moreover, it may be that under in vitro conditions, which obviously lack the normal brain milieu, rather than the dominating influence of the environment, the genotype of the cell plays a major role in determining the genes expressed. Clearly this is speculation and should be the subject of additional studies.
Ideally, the clinical significance of the U251 and U87 gene expression profiles generated from the i.c. model could be evaluated against the microarray data generated from glioma specimens obtained from patients. However, there are a number of obstacles to such a comparison. Surgical specimens will contain a mixture of tumor and normal human cells, each of which will contribute to the microarray expression analysis. In addition, given the recent information regarding the existence of tumor stem cells in gliomas and their potential significance to treatment response (14), the clinical specimens may actually contain a major population of irrelevant cells. Finally, the direct comparison of the expression data generated in this study by using cell lines to the results from microarray analyses of clinical material is severely constrained by a number of technical considerations, such as the use of different array platforms, analysis tools, and gene nomenclature (15).
Whereas the clinical relevance remains to be defined, the data presented here raise a number of questions regarding the influence of the in situ environment on gene expression. For example, it will be of interest to determine whether the growth of these glioma cell lines in other solid organs results in a convergence of their gene expression profiles, which will address the potential specificity of the orthotopic influence for the brain environment, at least for glioma cells. In addition, evaluating cell lines originating from other brain tumors as well as from other tumor histologies, particularly those that metastasize to the brain, should provide insight into the general role of the in situ brain milieu in regulating gene expression. Finally, the results presented here provide the basis for investigations aimed at defining the specific aspects of the brain environment that affect glioma cell gene expression. Such studies may generate critical insights into the fundamental role of normal tissue in regulating tumor phenotype. Moreover, identifying the regulating factors of the brain milieu may allow for the modification of tissue culture conditions to better simulate the in situ glioma cell phenotype, which would in turn provide a more experimentally expedient model for investigating glioma biology and defining therapeutic targets.
Supplementary Material
Author contributions: K.C., B.P., T.O., D.F.D., and P.J.T. designed research; B.P., M.S., T.S., and T.O. performed research; K.C., D.F.D., and P.J.T. analyzed data; and K.C., D.F.D., and P.J.T. wrote the paper.
Abbreviations: SCID, severe combined immunodeficient; PCA, principal component analysis; i.c., intracerebral(ly); SAM, significance analysis of microarray; GO, gene ontology.
References
- 1.Druker, B., Talpaz, M., Resta, D., Peng, B., Buchdunger, E., Ford, J., Lyndon, N., Kantarjian, H., Capdeville, R., Ohno-Jones, S. & Sawyers, C. (2001) N. Engl. J. Med. 344, 1031-1037. [DOI] [PubMed] [Google Scholar]
- 2.Alley, M., Scudiero, D., Monks, A., Hursey, M., Czerwinski, M., Fine, D., Abbott, B., Mayo, J., Shoemaker, R. & Boyd, M. (1988) Cancer Res. 48, 589-601. [PubMed] [Google Scholar]
- 3.Deschavanne, P. & Fertil, B. (1996) Int. J. Radiat. Oncol. Biol. Phys. 34, 251-266. [DOI] [PubMed] [Google Scholar]
- 4.O'Reilly, M., Holmgren, L., Shing, Y., Chen, C., Rosenthal, R., Moses, M., Lane, W., Cao, Y., Sage, H. & Folkman, J. (1994) Cell 79, 315-328. [DOI] [PubMed] [Google Scholar]
- 5.Chuang, Y., Chen, Y., Gadisetti, C., Cook, J., Coffin, D., Tsai, M., DeGraff, W., Yan, H., Zhao, S., Russo, A., et al. (2002) Cancer Res. 62, 6246-6254. [PubMed] [Google Scholar]
- 6.Eichler, G., Huang, S. & Ingber, D. (2003) Bioinformatics 19, 2321-2322. [DOI] [PubMed] [Google Scholar]
- 7.Tusher, V., Tibshirani, R. & Chu, G. (2001) Proc. Natl. Acad. Sci. USA 98, 5116-5121. [DOI] [PMC free article] [PubMed] [Google Scholar]
- 8.Troester, M., Hoadley, K., Sorlie, T., Herbert, B., Borresen-Dale, A., Lonning, P., Shay, J., Kaufmann, W. & Perou, C. (2004) Cancer Res. 64, 4218-4226. [DOI] [PubMed] [Google Scholar]
- 9.BeiBarth, T. & Speed, T. (2004) Bioinformatics 20, 1464-1465. [DOI] [PubMed] [Google Scholar]
- 10.Hubert, M. & Engelen, S. (2004) Bioinformatics 20, 1728-1736. [DOI] [PubMed] [Google Scholar]
- 11.Golden, A. & Schabel, F. (1981) Cancer Treat. Rep. 65, 11-19. [PubMed] [Google Scholar]
- 12.Gitler, M., Sausville, E., Hollingshead, M. & Shoemaker, R. (2004) Cancer Res. 64, 8478-8480. [DOI] [PubMed] [Google Scholar]
- 13.Gieseg, M., Man, M., Gorski, N., Madore, S., Kaldjian, E. & Leopold, W. (2004) BMC Cancer 4, 35. [DOI] [PMC free article] [PubMed] [Google Scholar]
- 14.Singh, S., Clarke, I., Hide, T. & Dirks, P. (2004) Oncogene 23, 7267-7273. [DOI] [PubMed] [Google Scholar]
- 15.Liu, J., Blackhall, F., Seiden-Long, I., Jurisica, I., Navab, R., Liu, N., Radulovich, N., Wigle, D., Sultan, M., Hu, J., et al. (2004) Oncogene 23, 6316-6324. [DOI] [PubMed] [Google Scholar]
Associated Data
This section collects any data citations, data availability statements, or supplementary materials included in this article.


