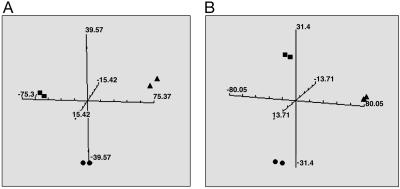
Fig. 1.
PCA for U251 cells grown in vitro and in vivo as s.c. and i.c. tumors. Gene expression profiles were generated for each growth condition in SCID (A) or nude (B) mice, and the principal components were calculated and plotted. Each plot is representative of two independent experiments with the duplicate symbols indicating the biological replicates. ▪ correspond to tissue culture, • correspond to s.c. tumors, and ▴ correspond to i.c. tumors.

