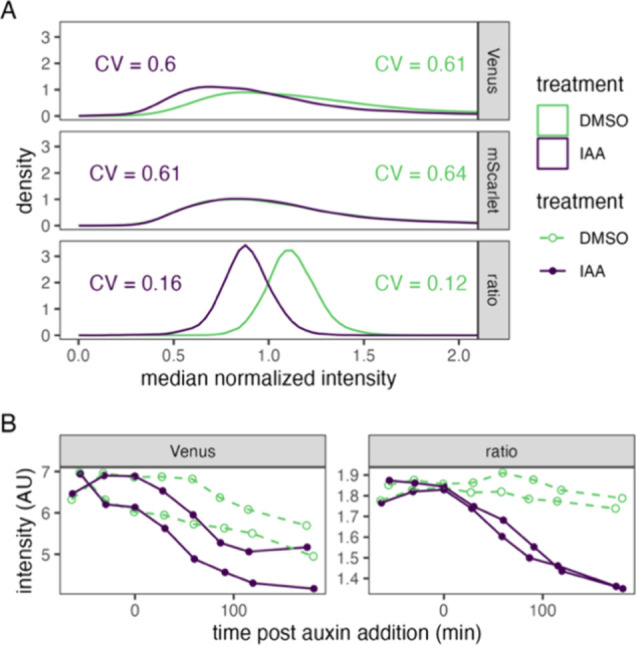
Figure 4.

Ratiometric measurement of auxin-induced protein degradation reduces clonal and growth phase variation relative to single color measurement. (A) Cultures expressing single-fusion TIR1 biosensors were treated with 50 μM indole-3-acetic acid (IAA) or DMSO (vehicle control) for 2 h prior to measurement of fluorescent intensity of single cells by flow cytometry. Values were normalized to the median of each culture and fluorophore or the ratio of raw Venus to mScarlet measurements to center the distributions. Lines represent kernel density estimates. Coefficients of variation (CV) for each population are shown. (B) Cultures of two independent clones of the yeast strain in A were treated as in (A) at time zero. Fluorescence intensity was measured by time-course flow cytometry. Population means are presented for each time point with each clonal culture shown as a separate line.
