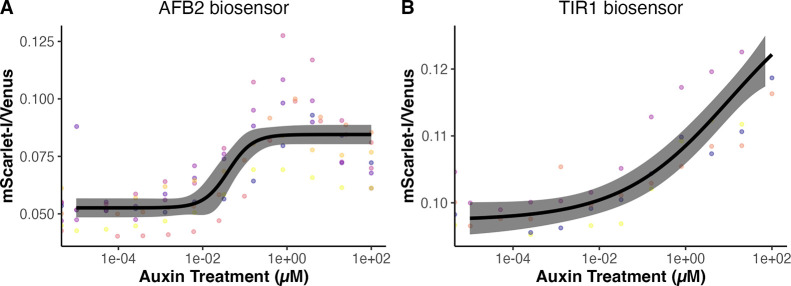
Figure 6.
Auxin dose–response curves of dual-fusion ratiometric biosensors. The ratio of mScarlet/Venus-Aux/IAA17 is shown, as it is proportional to auxin. In combination, the TIR1 and AFB2 dual-fusion biosensors respond to auxin concentrations spanning more than five orders of magnitude. Auxin dose–response curves were generated during the exponential phase of cultures expressing the TIR1 and AFB2 dual-fusion biosensors. (A) Auxin dose–response curve for the AFB2 dual-fusion biosensor, based on seven experimental replicates with different colonies on different days (points in different colors). Log–logistic models are shown as black lines, with 95% confidence intervals in gray. The overall EC50 for the AFB2 dual-fusion biosensor was 0.040 μM (SE = 0.016). (B) TIR1 dual-fusion biosensor response to various concentrations of extracellular auxin after 3 h (EC50 = 10.91 μM, SE = 20.39).

