Figure 7.

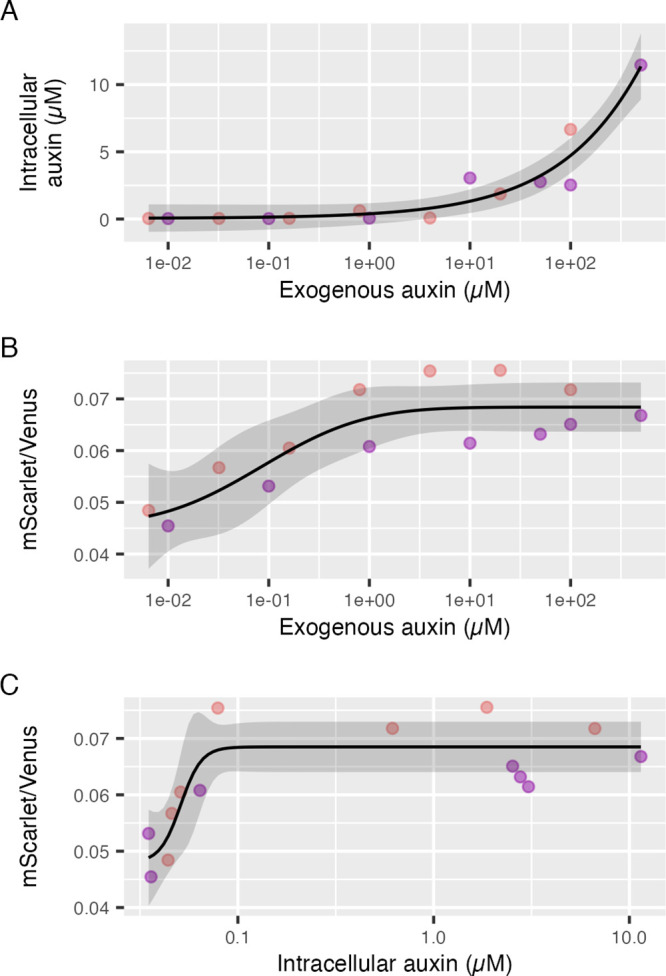
Comparison of LC-MS measurements of intracellular auxin to AFB2 dual-fusion biosensor response across different doses of exogenous auxin. AFB2 dual-fusion biosensor yeast cultures were treated with auxin across four orders of magnitude, and the biosensor response was measured by flow cytometry throughout the exponential growth phase to define steady-state biosensor responses. Following these measurements, cultures were washed and lysed for measurement of intracellular auxin by LC-MS. In each plot, pink and purple points represent two replicate experiments on two different days. Dose–response models are shown as black lines with 95% confidence intervals as gray ribbons. (A) Intracellular auxin as measured by LC-MS versus dose of exogenous auxin after 3 h of treatment. (B) Steady-state biosensor response as the ratio of AFB2-mScarlet-I to Venus-Aux/IAA, which is proportional to auxin concentration, versus dose of exogenous auxin after 3 h of treatment. (C) Biosensor response, as above, versus in intracellular auxin concentrations as determined by LC-MS.
