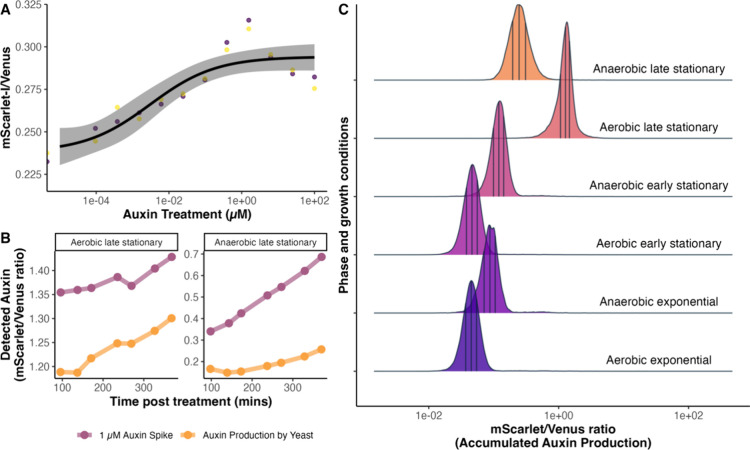
Figure 8.
The dual-fusion AFB2 biosensor predicts that auxin accumulates in stationary phase cultures. (A) Dose–response curve for auxin at the early stationary phase. Two yeast colonies carrying the AFB2 dual-fusion biosensor respond to exogenous auxin during this phase with an EC50 of 0.003 μM exogenous auxin (SE = 0.00338). (B) Auxin accumulation in the cultures at the late stationary phase (yellow) and a 1 μM auxin spike in the cultures (purple), after 48 h of inoculation, measured by the dual-fusion AFB2 biosensor every 45 min for 6 h. (C) Yeast cultures expressing the AFB2 dual-fusion auxin biosensor were inoculated at varying rates to reach different phases of growth after 16 h of incubation in static fermentative (anaerobic) conditions or shaken (aerobic) conditions. Distributions represent flow cytometric measurements of the ratio of fluorescent intensity areas of AFB2-mScarlet to Venus-Aux/IAA17, which is proportional to the predicted/perceived auxin. Each curve represents the kernel density plot of 104 individual cells. The vertical lines divide the density into quartiles with the middle line representing the median and outer lines representing 25 and 75% of the density.

