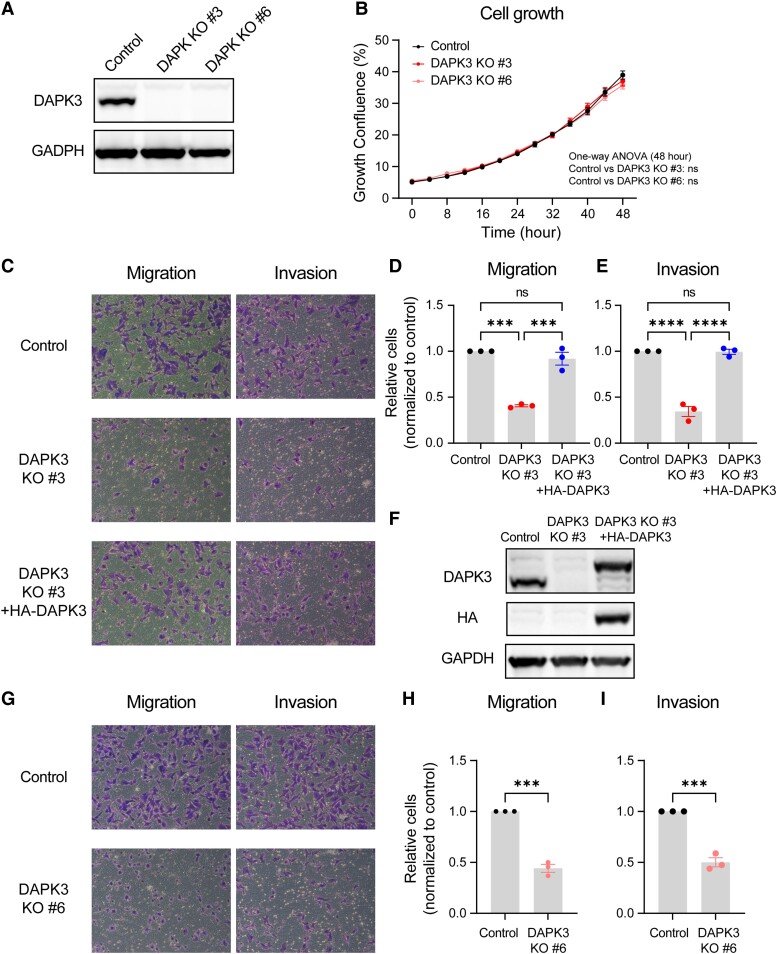
Fig. 2.
DAPK3 knockout decreases migration and invasion of SUM159 cells. A) Immunoblotting shows the protein levels of DAPK3 in SUM159 control, DAPK3 KO #3, and DAPK3 KO #6 cells. GAPDH serves as a loading control. The representative image is based on three independent experiments. B) The confluence of SUM159 control, DAPK3 KO #3, and DAPK3 KO #6 cells at indicated time points acquired by the IncuCyte imaging system. The data are the representative of three independent experiments. NS, not significant (one-way ANOVA with Dunnett's multiple comparisons test, comparing the confluency of DAPK3 KO #3 or #6 with control group at the last time point measured). C) Representative transwell migration and invasion assay images (10 × magnification) from SUM159 control, DAPK3 KO #3 cells, and DAPK3 KO #3 cells with HA-tagged DAPK3 overexpression. SUM159 DAPK3 KO #3 cells have decreased migration and invasion potential compared with control cells. DAPK3 overexpression rescues the migration and invasion phenotypes in DAPK3 KO #3 cells. D), E) ImageJ-based quantification results of C. Data represent the mean ± SEM from three independent experiments. NS, not significant, ****P < 0.0001, ***P < 0.001, one-way ANOVA with Tukey's multiple comparisons test. F) Immunoblotting shows the protein levels of DAPK3 and HA-tagged DAPK3 in SUM159 control, DAPK3 KO #3 cells, and DAPK3 KO #3 cells with HA-tagged DAPK3 overexpression. GAPDH serves as a loading control. The representative image is based on three independent experiments. G) Representative transwell migration and invasion assay images (10 × magnification) from SUM159 control and DAPK3 KO #6 cells. SUM159 DAPK3 KO #6 cells have decreased migration and invasion potential compared with control cells. H), I) ImageJ-based quantification results of G. Data represent the mean ± SEM from three independent experiments. NS, not significant, ***P < 0.001, Student's t test.

