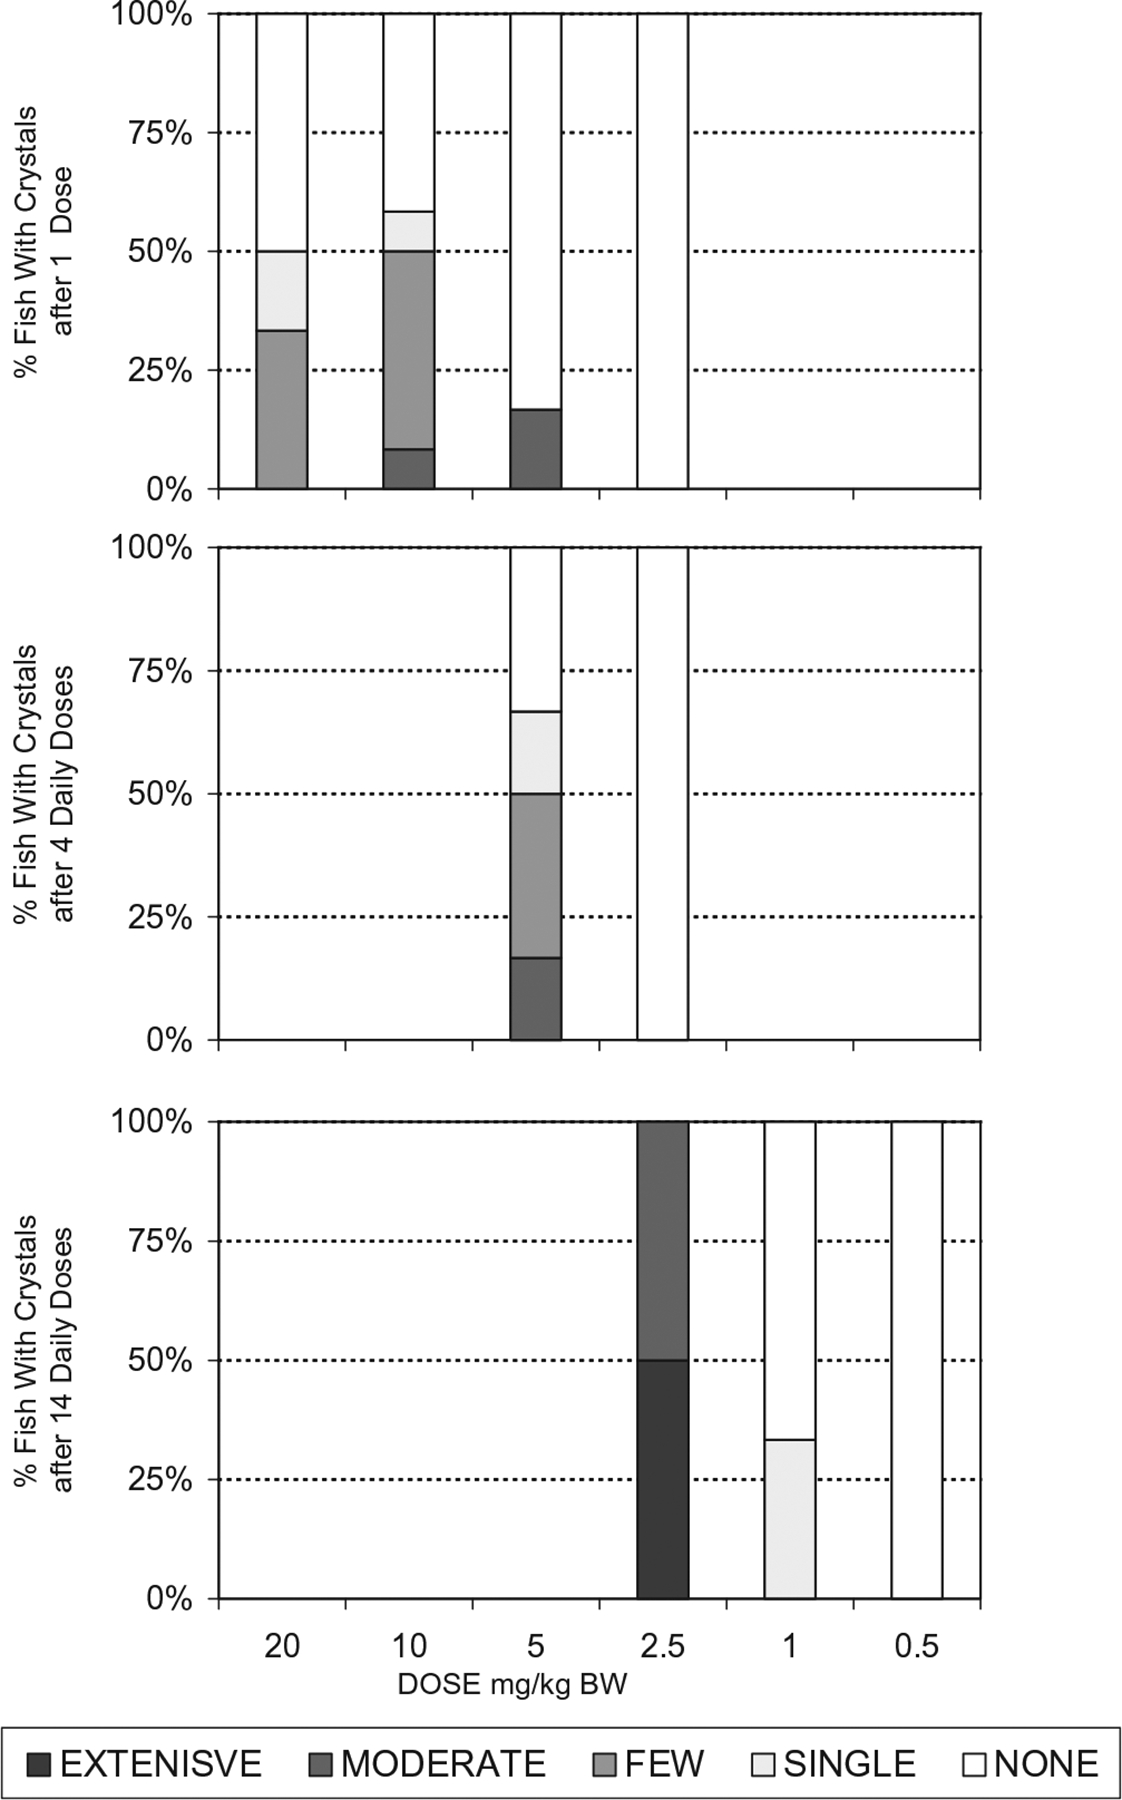
Fig. 3.

Crystal intensity breakdown observed in kidney wet mount sections from trout administered melamine and cyanuric acid. A dose response is seen in the data for multiple doses as number of trout with crystals as well as crystal intensity decreased as dose decreased. For each individual dosage level:number of doses combination, n = 6–12. The subjective scale for crystal rankings was as follows: None – none seen (numerical rank 0); single- only 1 crystal in an entire section – (numerical rank 1); few – few with scattered distribution – (numerical rank 2); moderate – moderate numbers seen throughout section – (numerical rank 3); extensive – large numbers seen immediately (numerical ranks 4–5).
