
Figure 2.
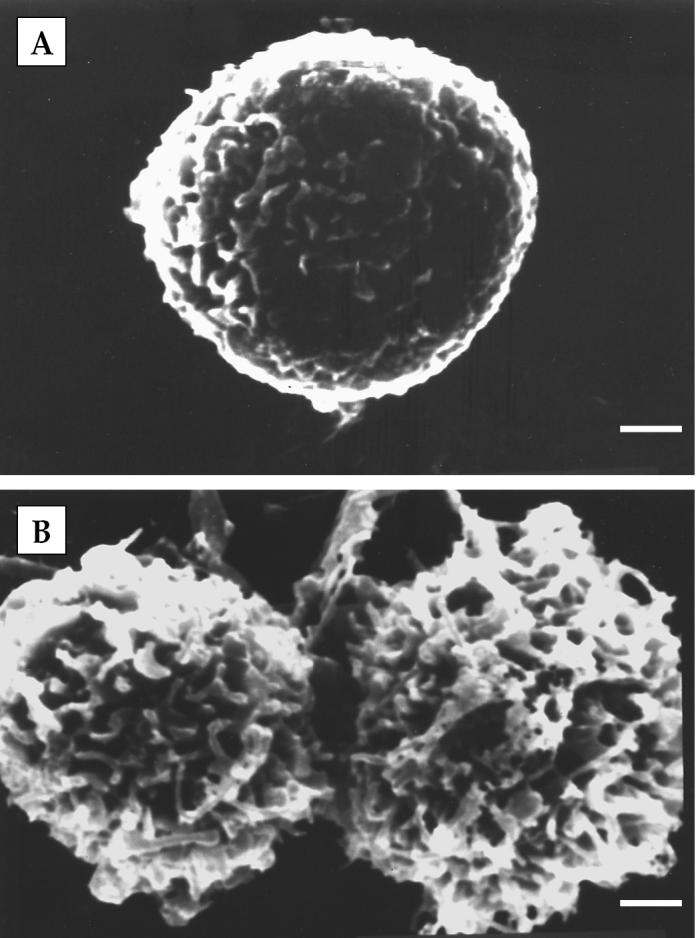
Scanning electron micrographs of neutrophils isolated from blood (A) and milk (B) of peak lactation goats. Milk neutrophils displayed a more ruffled surface compared to blood neutrophils. Bar = 1 μm.
Official websites use .gov
A
.gov website belongs to an official
government organization in the United States.
Secure .gov websites use HTTPS
A lock (
) or https:// means you've safely
connected to the .gov website. Share sensitive
information only on official, secure websites.
Scanning electron micrographs of neutrophils isolated from blood (A) and milk (B) of peak lactation goats. Milk neutrophils displayed a more ruffled surface compared to blood neutrophils. Bar = 1 μm.