

Abstract
The acute oral toxicity of diglycolic acid (DGA) was evaluated. Groups of female rats (n = 8 rats/group) received 28 consecutive daily single doses of 0.3, 1.0, 3.0, 10.0, 30.0, 100.0 or 300.0 mg DGA/kg body weight by gastric intubation. One group of animals served as vehicle control. Tissues and blood serum were collected at necropsy on day 29. Select organs were weighed and fixed in formalin for histopathological analysis. Animals from the 300 mg/kg bw dose group were removed from the study after 5 consecutive days of treatment as a consequence of adverse treatment related effects. The animals in the remaining treatment groups survived the exposure period. No adverse clinical signs were observed throughout the exposure period in the surviving animals. No significant differences from controls were observed for feed and fluid consumption or body weight gain in the surviving animals. Lesions were observed in the kidneys, liver, stomach, intestine, thymus, spleen and bone marrow in rats from the 300 mg/kg dose group and signs of renal tubular regeneration were observed only in the 100 mg/kg dose group. These results suggest that high levels of pure DGA would need to be consumed before renal and other forms of organ toxicity are observed.
Keywords: Diglycolic acid, Renal toxicity, Hepatic toxicity, Oral exposure
1. Introduction
Diglycolic acid (DGA), a minor metabolite of diethylene glycol (DEG) has been implicated as one of two active agents responsible for human renal toxicity associated with several mass poisonings in which DEG (CAS RN 111-46-6) was illegally substituted for pro-pylene glycol or glycerin in fever reducers (Bowie and McKenzie, 1972; Hanif et al., 1995), topical medications for the treatment of burns (Cantarell et al., 1987), medicinal glycerol products (Pandya, 1988), medications for upper respiratory tract infections (Okuonghae et al., 1992) and in traditional/ethnobotanical uses for inflammation, wound healing and cosmetic purposes (Drut et al., 1994; Ferrari and Giannuzzi, 2005). DGA specifically affects cells of the human proximal tubule (HPT) and rapidly accumulates in these cells proposedly as a consequence of enhanced uptake by dicarboxylate transporters found on the HPT cells (Landry et al., 2011). The accumulation of DGA in the HPT ultimately leads to DGA-induced severe cortical necrosis (Ferrari and Giannuzzi, 2005; Herbert et al., 1978). In all of the above cases, poisoned individuals presented with acute renal failure, metabolic acidosis, neurologic symptoms and other end organ effects.
Recently, it was reported that DGA is an impurity produced during the synthesis of several carboxymethyl carbohydrate preparations (CMPs) including carboxymethyl cellulose and carboxymethyl starches and that it cannot be completely removed from these preparations (Koschella et al., 2011). CMPs are used in the food science and drug industries as thickening agents, emulsion stabilizers, suspending agents and tablet binders. As such, there is a potential for human exposure through the consumption of processed foods like boxed cake mixes and ice cream products as well as tablet formulations.
A literature review indicated that the available information on DGA toxicity was limited. Preliminary information from a 28 day dose response study conducted in our laboratory using nine different dose levels suggested that low dose exposure to DGA in nulliparous female Sprague-Dawley rats did not adversely affect kidney or liver function; however, at elevated DGA dosages (300 mg/kg bw) marked kidney and liver effects were observed (Keltner et al., 2015; Mossoba et al., 2015). These findings suggested a sharp dose response curve for DGA. At the time this data was presented a comprehensive pathological examination of the tissues and complete clinical chemistry results were not available and as such this information was not reported. Recently, Robinson et al. (2017) using limited exposure dosages demonstrated similar effects in male Wistar rats. To date a comprehensive dose-response characterization of the effects of DGA on the kidney and liver in the rat has not been published nor have other target organs been identified. This manuscript presents comprehensive toxicological findings on DGA toxicity obtained from an acute rat 28-day repeated dose oral toxicity study highlighting effect observed on the liver and kidney and describing effects on other target organs induced as a consequence of high dose DGA exposure.
2. Materials and methods
2.1. Animals and animal husbandry
The experimental protocol was approved by the Animal Care and Use Committee at the Office of Applied Research and Safety Assessment, Center for Food Safety and Applied Nutrition, U.S. Food and Drug Administration, and all procedures were conducted in accordance with the principles stated in the Guide for the Care and Use of Laboratory Animals (2011) and the Animal Welfare Act of 1966 (P.L. 89–544), as amended. Female Sprague Dawley rats (Charles River Laboratories, Inc., Wilmington, MA) were used as experimental animals and placed in acclimation for up to one week during which time they were singly housed in polycarbonate micro isolators. Females were utilized in this study because it has been shown that in cases where gender differences exist, females have been shown to be more sensitive to toxic insult than males. All animals received Harlan 2018 Certified rodent chow (meal) and reverse osmosis deionized water ad libitum. After acclimation, the animals were placed into polycarbonate tubs containing sani chips and ear tagged (Monel metal ear tags, size no. 1, Newport, Kentucky). The ear tag number was utilized to track these animals throughout the study. Light in the study room was provided on a 12-h light/dark cycle, the room temperature was maintained at 73–74 °F and the relative humidity was maintained at 48–59%. All dosed animals were observed twice daily for signs of toxicity. Animals found in a moribund condition and animals showing severe pain or enduring signs of severe distress were euthanized using carbon dioxide. Signs of toxicity include lethargy, anorexia, hunched posture, ruffled coat and loose stool. Animals euthanized are considered equivalent to animals that died on test.
2.2. Test material
The test article, diglycolic acid (DGA purity = 99%), was ordered from Sigma-Aldrich and stored according to the MSDS Sheets supplied by the manufacturer (dry, at room temperature). DGA was administered in water by gastric intubation at a volume of 10 ml/kg of body weight. Solutions were prepared by dissolving the appropriate amount of test article in ultra-pure water (18.2 MΩ) from an A10 Advantage water purification system (Millipore, Billerica, MA). Solutions were stored in the refrigerator and allowed to come to room temperature before administration and analysis. The gavage dosing solutions were analyzed in-house using a triple-quadrupole mass spectrometer in MRM mode monitoring the 133 → 75.1 and 133 → 89.1 transitions. Isotopically-labelled d4-DGA (98% purity, Cambridge Isotopes) was used as an internal standard. Dosing solutions were found to be within ±10% of the target dose. Solutions were re-analyzed after 14 and 28 days to ensure stability.
2.3. Experimental design
Sixty-four nulliparous female Sprague Dawley rats (VAF/Plus) 57–70 days old and weighing 201–225 g were assigned to one of eight experimental groups (n = 8 animal/group) by weight using a stratified random assignment procedure. The dose levels tested were 0, 0.3, 1.0, 3.0, 10.0, 30.0, 100.0 and 300.0 mg/kg of body weight (bw). Each animal cohort was assigned a group number proportional to its dose level such that animals assigned to receive the lowest (0 mg/kg bw) and highest treatment doses (300.0 mg/kg bw) were classified as Group 1 and Group 8, respectively. DGA was administered in water by gastric intubation on a daily basis for 28 consecutive days using a volume of 10 ml/kg bw. Double distilled deionized water served as the vehicle control. All dosing solutions were analyzed prior to administration to ensure that they were within ±10% of the target dose. During the dosing period, feed and fluid consumption were measured every 3 days. Water was provided in 16 oz water bottles and each study animal was supplied with a fresh water bottle every 3 days. Feed was provided in Holtge Study animal feed cups, which were changed every 6 days. Feed cups and water bottles were checked twice per day to ensure that feed and fluid was available to all study animals.
During the course of the study, animals were placed into metabolism cages on exposure days 2, 4, 8, 16, 22 and 26 and urine samples were collected the following morning (20 ± 2 h urine collection). While in metabolism cages, water was provided in water bottles and feed cups were provided with the metabolism cages. Water bottles and feed cups were checked twice per day to ensure that fluids were available to the animals on study. Metabolism cage feeders and water bottles were changed daily.
2.3.1. Urine analysis
Standard urine analysis was conducted on all urine samples. Urine samples were spun at 3000 rpm for 10 min at 4 °C. The urine samples were frozen at −80 °C for subsequent evaluation of early biomarkers of renal toxicity (Mossoba et al., 2017). Urine test strips were used for the determination of Ketones, Glucose, Protein and plus Leukocytes, Nitrites, Bilirubin, Blood, Urobilinogen, and Specific Gravity levels in urine.
2.4. Pathology and clinical chemistry
On day 29, experimental and control animals were euthanized with carbon dioxide. Blood serum was collected and select organs were weighed and preserved in formalin. Serum was submitted for clinical chemistry analysis and tissue samples were submitted for histopathologic analysis.
2.4.1. Pathology
Animals were euthanized by carbon dioxide inhalation and blood was withdrawn via hepatic portal vein until exsanguination. At euthanasia, experimental animals were examined for gross abnormalities. The heart, intestine, kidneys, glandular stomach, liver, thymus, spleen were examined. Organs with gross lesions were preserved in 10% neutral buffered formalin. Additionally, both the sternum and femur were preserved in 10% formalin for evaluation of the bone marrow. Tissues were embedded in paraffin, sectioned at 3–5 ;Cm, stained with hematoxylin and eosin and examined by light microscopy. Histopathological tissue preparation and examination of the fixed tissues was done by Experimental Pathology Laboratories, Inc. (Herndon, VA).
2.4.2. Blood serum collection
Blood was allowed to clot at room temperature for 30 min, centrifuged at approximately 3000 rpm for 10 min with a Beckman CS-6R bench top refrigerated centrifuge (4 °C). Serum was removed, decanted into scintillation vials and stored at −80 °C until it was analyzed for alkaline phosphatase (ALKP), alanine aminotransferase (ALT), aspartate aminotransferase (AST), creatine kinase (CK), total bilirubin (TBIL), blood urea nitrogen (BUN), creatinine (CREA), glucose (GLU), uric acid (URIC) on a VetTest™ Chemistry Analyzer (IDEXX Laboratories, Inc., Westbrook, ME).
2.5. Statistical analysis
Data was analyzed using a one-way ANOVA’s. Body weight gains (or loss), cumulative fluid and feed consumption from day 1–5, day 1–7, day 8–14, day 15–21, day 22–29 and day 1–29, organ weights standardized to brain weight, and serum values were compared to control using Dunnett’s test, adjusting for unequal variances when necessary.
3. Results
Animals from the 300 mg/kg bw DGA dose group were removed from the study on exposure day 5 of treatment as a consequence of multiple organ system failure. Animals from the other exposure groups survived the 28-day exposure period without showing any adverse clinical signs as a consequence of DGA exposure.
3.1. Body weight gain, feed consumption, water consumption
At the beginning of the study (Day 0) the average female rat body weights (measured in g ± SEM) were similar within and between all treatment groups (Fig. 1). Body weights measured at each time point between Day 0 and 28 remained similar among Groups 1 through 7, representing treatment doses 0 through 100 mg/kg bw. The body weight of animals in Group 8 receiving 300 mg/kg bw, however, decreased significantly (approximately 9% reduction) by Day 5 of treatment, when euthanasia was necessary due to animals being in morbid conditions (Fig. 1).
Fig. 1.
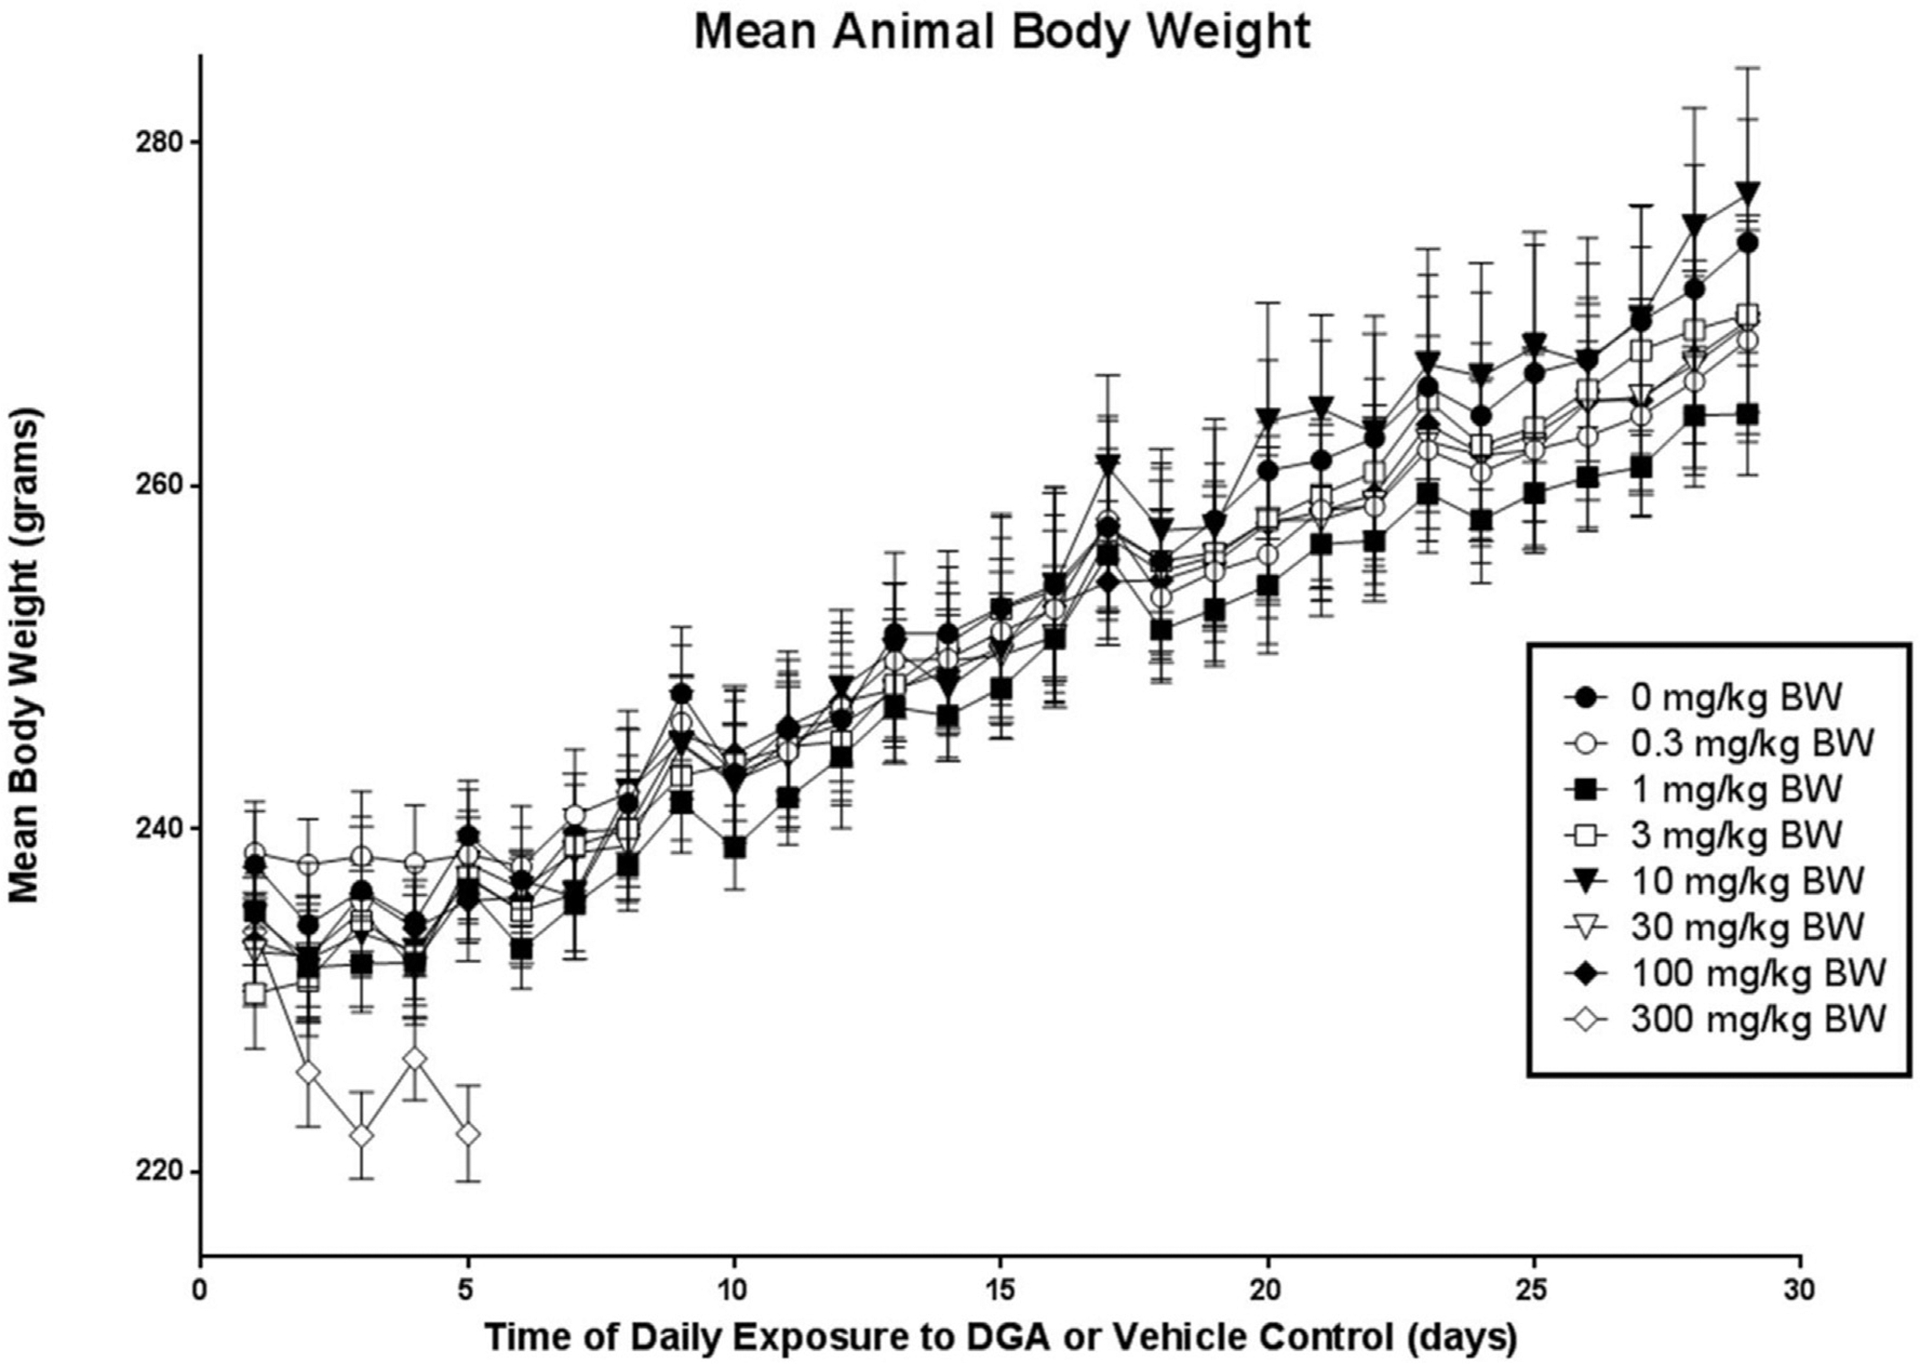
Mean body weight data for vehicle controls and animals exposed to DGA at one of seven different concentrations over a 28 day period.
Table 1 shows the mean body weight gain (g ± SEM) as well as feed and fluid consumption (g ± SEM) for experimental animals from the DGA and vehicle control groups during the 28 days of treatment. Statistically significant reductions in mean body weight gain and feed and fluid consumption were observed within the first 5 days of exposure in Group 8 animals (300 mg/kg dose group) when compared to Group 1 controls. By contrast, no significant differences were observed in these three parameters when animals in Groups 2 through 7 were compared to Group 1, the vehicle control (Table 1).
Table 1.
Mean body weight gain and feed and fluid consumption (g ± SEM) in DGA- or vehicle-exposed animals (n = 8/group) over the 28-day exposure period.
| Days | Dose of diglycolic acid in mg/kg bw | |||||||
|---|---|---|---|---|---|---|---|---|
| 0 | 0.3 | 1.0 | 3.0 | 10.0 | 30.0 | 100.0 | 300.0 | |
| Mean Body Weight Gain | ||||||||
| 1 to 5 | 1.8 ± 2.14 | −0.1 ± 2.43 | 1.2 ± 1.57 | 6.9 ± 2.75 | 2.2 ± 1.77 | 5.2 ± 1.99 | 2.4 ± 1.86 | −11.8 ± 2.86* |
| 1 to 7 | −1.9 ± 3.47 | 2.1 ± 2.53 | 0.4 ± 2.43 | 8.6 ± 1.49 | 1.4 ± 1.93 | 5.9 ± 1.01 | 6.4 ± 2.38 | NA |
| 8 to 14 | 15.4 ± 3.28 | 9.1 ± 1.85 | 11.0 ± 2.04 | 11.8 ± 1.72 | 12.0 ± 2.56 | 11.1 ± 3.14 | 9.5 ± 1.61 | NA |
| 15 to 21 | 10.1 ± 2.52 | 8.8 ± 1.46 | 10.0 ± 1.67 | 8.8 ± 1.22 | 16.2 ± 1.63 | 8.2 ± 2.14 | 9.2 ± 1.92 | NA |
| 22 to 29 | 12.8 ± 1.82 | 9.9 ± 1.90 | 7.6 ± 1.56 | 10.5 ± 1.59 | 12.5 ± 2.29 | 11.4 ± 1.64 | 11.1 ± 1.43 | NA |
| Total Gain | 36.4 ± 4.12 | 29.9 ± 5.14 | 29.0 ± 2.61 | 39.6 ± 3.87 | 42.1 ± 5.71 | 36.6 ± 6.30 | 36.2 ± 3.44 | NA |
| Mean Total Feed Consumption | ||||||||
| 1 to 5 | 61.5 ± 2.39 | 61.1 ± 2.55 | 59.0 ± 1.20 | 66.0 ± 3.30 | 62.9 ± 3.41 | 64.6 ± 1.83 | 58.8 ± 1.66 | 10.5 ± 2.97** |
| 1 to 7 | 87.9 ± 3.74 | 91.5 ± 2.90 | 87.9 ± 1.42 | 95.9 ± 3.49 | 91.9 ± 3.81 | 94.1 ± 2.45 | 90.0 ± 2.42 | NA |
| 8 to 14 | 118.4 ± 4.33 | 110.0 ± 4.28 | 111.5 ± 2.97 | 116.0 ± 3.51 | 118.1 ± 4.13 | 113.4 ± 4.45 | 114.4 ± 2.53 | NA |
| 15 to 21 | 117.5.2 ± 4.75 | 114.4 ± 5.37 | 115.2.4 ± 2.45 | 117.2 ± 3.38 | 121.9 ± 4.93 | 114.9 ± 2.94 | 113.4 ± 2.58 | NA |
| 22 to 29 | 134.4 ± 3.96 | 129.9 ± 5.05 | 128.6 ± 3.33 | 133.8 ± 3.67 | 138.1 ± 4.91 | 129.8 ± 4.24 | 132.1 ± 4.00 | NA |
| 1 to 29 | 458.1 ± 13.04 | 445.8 ± 15.25 | 443.2 ± 7.65 | 462.9 ± 12.82 | 470.1 ± 16.80 | 452.1 ± 10.85 | 449.9 ± 10.34 | NA |
| Mean Fluid Consumption | ||||||||
| 1 to 5 | 114.6 ± 9.28 | 112.4 ± 4.18 | 108.5 ± 5.81 | 118.1 ± 5.27 | 116.4 ± 8.06 | 111.8 ± 5.22 | 117.2 ± 4.90 | 77.2 ± 5.28** |
| 1 to 7 | 161.5 ± 12.80 | 163.8 ± 7.13 | 158.5 ± 9.19 | 173.2 ± 7.31 | 165.5 ± 8.20 | 160.5 ± 6.30 | 170.6 ± 7.34 | NA |
| 8 to 14 | 200.62 ± 15.40 | 187.8 ± 10.41 | 195.9 ± 11.72 | 196.6 ± 7.43 | 204.2 ± 9.41 | 180.2 ± 10.52 | 200.5 ± 8.50 | NA |
| 15 to 21 | 188.9 ± 14.59 | 194.5 ± 16.15 | 189.2 ± 9.66 | 188.0 ± 11.16 | 205.8 ± 10.66 | 178.0 ± 8.60 | 205.4 ± 12.33 | NA |
| 22 to 29 | 236.4 ± 20.46 | 214.8 ± 18.78 | 225.2 ± 19.44 | 216.6 ± 12.48 | 230.8 ± 12.88 | 219.8 ± 16.66 | 230.9 ± 15.33 | NA |
| 1 to 29 | 787.4 ± 58.59 | 760.8 ± 49.18 | 768.9 ± 46.12 | 777.5 ± 37.04 | 806.2 ± 37.62 | 738.5 ± 37.85 | 807.4 ± 40.96 | NA |
p < 0.0004;
p < 0.0001; NA: Not applicable; animals moribund and euthanized on Day 5.
3.2. Macroscopic observations
Table 2 shows the average organ to brain weight ratios from animals in the vehicle control and each DGA treatment group. Exposure-related effects were only observed in Group 8 animals receiving 300 mg/kg bw DGA. In this cohort, one of the most notable observations was the increased liver to brain ratio value of 7.503 ± 0.395, which was significantly higher than the control ratio value of 5.069 ± 0.230 (p < 0.0005). Animals in Group 8 also had significantly larger kidneys when left, right, or mean kidney to brain ratios were directly compared to control values. As listed in Table 2, animals in this highest dose cohort had an average left kidney to brain ratio of 0.800 ± 0.046 (vs. control value 0.481 ± 0.015), right kidney to brain ratio of 0.833 ± 0.033 (vs. control value 0.489 ± 0.021), and mean kidneys to brain ratio of 0.816 ± 0.038 (vs. control value 0.485 ± 0.017). Interestingly, at the gross macroscopic level, the whole livers and kidneys from the 300 mg/kg dose group had a mottled outer appearance. Gross morphological observation of the sectioned kidneys revealed that the renal cortices of the animals from the 300 mg/kg dose group were pale in color and appeared avascular compared to the darker hemorrhagic appearance of the renal medulla.
Table 2.
Mean organ to brain weight (g ± SEM) ratios in DGA- or vehicle-exposed animals (n = 8/group) over the 28-day exposure period.
| Dose of diglycolic acid in mg/kg bw | ||||||||
|---|---|---|---|---|---|---|---|---|
| 0 | 0.3 | 1.0 | 3.0 | 10.0 | 30.0 | 100.0 | 300.0 | |
| Body Weight | 273.0 ± 8.03 | 268.5 ± 5.94 | 264.2 ± 3.58 | 270.0 ± 5.46 | 277.0 ± 7.39 | 269.4 ± 6.38 | 269.6 ± 5.31 | 222.2 ± 2.80& |
| Brain Weight | 1.96 ± 0.028 | 1.95 ± 0.032 | 1.93 ± 0.031 | 1.92 ± 0.029 | 1.89 ± 0.044 | 1.92 ± 0.021 | 1.95 ± 0.021 | 1.86 ± 0.046 |
| Thymus/Brain | 0.273 ± 0.011 | 0.218 ± 0.010 | 0.236 ± 0.020 | 0.281 ± 0.018 | 0.292 ± 0.021 | 0.282 ± 0.020 | 0.243 ± 0.019 | 0.150 ± 0.019@ |
| Spleen/Brain | 0.301 ± 0.016 | 0.302 ± 0.016 | 0.292 ± 0.016 | 0.289 ± 0.012 | 0.297 ± 0.019 | 0.297 ± 0.011 | 0.293 ± 0.012 | 0.226 ± 0.018@ |
| Stomach/Brain | 0.644 ± 0.030 | 0.659 ± 0.029 | 0.634 ± 0.030 | 0.737 ± 0.037 | 0.747 ± 0.065 | 0.723 ± 0.047 | 0.682 ± 0.024 | 0.675 ± 0.037 |
| Liver/Brain | 5.069 ± 0.230 | 5.159 ± 0.202 | 4.930 ± 0.115 | 5.160 ± 0.138 | 5.401 ± 0.263 | 5.195 ± 0.267 | 5.332 ± 0.276 | 7.503 ± 0.395& |
| Heart/Brain | 0.486 ± 0.023 | 0.481 ± 0.014 | 0.480 ± 0.015 | 0.506 ± 0.020 | 0.497 ± 0.025 | 0.486 ± 0.014 | 0.481 ± 0.017 | 0.471 ± 0.017 |
| Left Kidney/Brain | 0.481 ± 0.015 | 0.466 ± 0.015 | 0.477 ± 0.017 | 0.477 ± 0.018 | 0.488 ± 0.016 | 0.471 ± 0.014 | 0.484 ± 0.021 | 0.800 ± 0.046* |
| Right Kidney/Brain | 0.489 ± 0.021 | 0.476 ± 0.015 | 0.497 ± 0.013 | 0.490 ± 0.016 | 0.495 ± 0.017 | 0.494 ± 0.015 | 0.495 ± 0.019 | 0.833 ± 0.033* |
| Mean Kidneys/Brain | 0.485 ± 0.017 | 0.471 ± 0.015 | 0.487 ± 0.014 | 0.484 ± 0.017 | 0.491 ± 0.016 | 0.482 ± 0.013 | 0.490 ± 0.020 | 0.816 ± 0.038* |
| Left Adrenal/Brain | 0.019 ± 0.002 | 0.020 ± 0.002 | 0.018 ± 0.001 | 0.020 ± 0.002 | 0.020 ± 0.002 | 0.022 ± 0.002 | 0.018 ± 0.002 | 0.032 ± 0.001* |
| Right Adrenal/Brain | 0.017 ± 0.002 | 0.020 ± 0.002 | 0.017 ± 0.001 | 0.017 ± 0.002 | 0.019 ± 0.002 | 0.021 ± 0.002 | 0.018 ± 0.001 | 0.031 ± 0.001* |
| Mean Adrenals/Brain | 0.018 ± 0.002 | 0.020 ± 0.002 | 0.017 ± 0.001 | 0.018 ± 0.002 | 0.020 ± 0.002 | 0.021 ± 0.001 | 0.018 ± 0.001 | 0.031 ± 0.001* |
| Left Ovary/Brain | 0.046 ± 0.004 | 0.038 ± 0.003 | 0.035 ± 0.003 | 0.040 ± 0.003 | 0.040 ± 0.003 | 0.034 ± 0.005 | 0.035 ± 0.002 | 0.038 ± 0.003 |
| Right Ovary/Brain | 0.043 ± 0.003 | 0.041 ± 0.003 | 0.040 ± 0.003 | 0.043 ± 0.002 | 0.040 ± 0.002 | 0.044 ± 0.003 | 0.037 ± 0.004 | 0.031 ± 0.002@ |
| Mean Ovaries/Brain | 0.044 ± 0.003 | 0.040 ± 0.002 | 0.037 ± 0.003 | 0.041 ± 0.002 | 0.040 ± 0.003 | 0.039 ± 0.004 | 0.036 ± 0.002 | 0.034 ± 0.002@ |
p < 0.0001;
p < 0.0005;
p < 0.05.
Unlike animals in Groups 1 through 7, those in Group 8 also yielded statistically significant changes in other organ weights. Specifically, 300 mg/kg bw treatment led to lower thymic, spleen and ovarian weight to brain ratio values relative to those of the vehicle control treatment, as well as a higher average adrenal to brain weight ratio value versus control, as shown in Table 2. No other significant changes in the ratios of organ to brain weights were found when animals were treated with DGA doses of 100 mg/kg bw or lower.
3.3. Microscopic observations
Histopathological analysis of organ sections from animals treated with 30 mg/kg bw or less revealed no adverse histopathological effects in any of the organs selected for analysis (thymus, spleen, stomach, liver, kidneys, adrenals, ovaries). At the treatment dose of 100 mg/kg bw, however, the kidneys uniquely showed evidence of change; minor renal tubule regeneration was the only microscopic observation. Regeneration was characterized by a flattened epithelium, tubule epithelial cell basophilia and nuclear crowding (Fig. 2A–F). Dose related effects were not observed in any other organs examined from the 100 mg/kg dose group. In contrast, extensive DGA exposure related damage occurred in multiple organs from animals in the 300 mg/kg bw. The severity of the response between the 300 mg/kg bw DGA dose group and the other DGA dose groups was dramatic. Renal failure occurred in this group at treatment Day 5, necessitating their removal from the study. As shown in Fig. 2G and H, marked effects were observed on the renal cortical proximal convoluted tubules. These effects included renal tubule vacuolar degeneration and necrosis, with evidence of renal regeneration and mineralization. Additional severe treatment related effects were observed in other organs examined and included microvesicular centrilobular vacuolization in the liver (Fig. 3A–D), necrosis and decreased numbers of cortical lymphocytes in the thymus (Fig. 4A and B), depletion of white pulp lymphocytes in the spleen (Fig. 5A and B), vacuolization of the lining epithelium in the stomach (Fig. 6A–D) and small intestines (Fig. 7A–D) and a decrease in the number of hematopoietic cells with a concomitant increase in the prominence of reticular stroma in the sternal bone marrow (Fig. 8A–D).
Fig. 2.

Representative photomicrographs of hematoxylin and eosin stained sections of the renal cortex of rats treated with vehicle and DGA at concentrations up to and including 30 mg/kg bw (Fig. 2A 400×; 2B 100×). Note the intact glomerulus (G) and proximal and distal convoluted tubules (T). Animal exposed to DGA at concentrations up to 30 mg/kg bw were histologically indistinguishable from the control group (Fig. 2A and 2B). Renal tubule regeneration (Tr) was observed only in the 100 mg/kg bw dose group (Fig. 2C, 400×;Fig. 2D, 100×). Regeneration (stars) was characterized by a relatively flattened epithelium, basophilia and nuclear crowding (Fig. 2E, 2F, 600×). Fig. 1G and H are representative photomicrographs of the renal cortex from rats exposed to DGA at a concentration of 300 mg/kg bw. Note the vacuolization (Tv), mineralization (Tm) and necrosis (Tn) of the cortical tubules (T). The glomerulus (G) appears not to be affected by DGA exposure. (Fig. 2G, 600×; Fig. 2H, 100×).
Fig. 3.
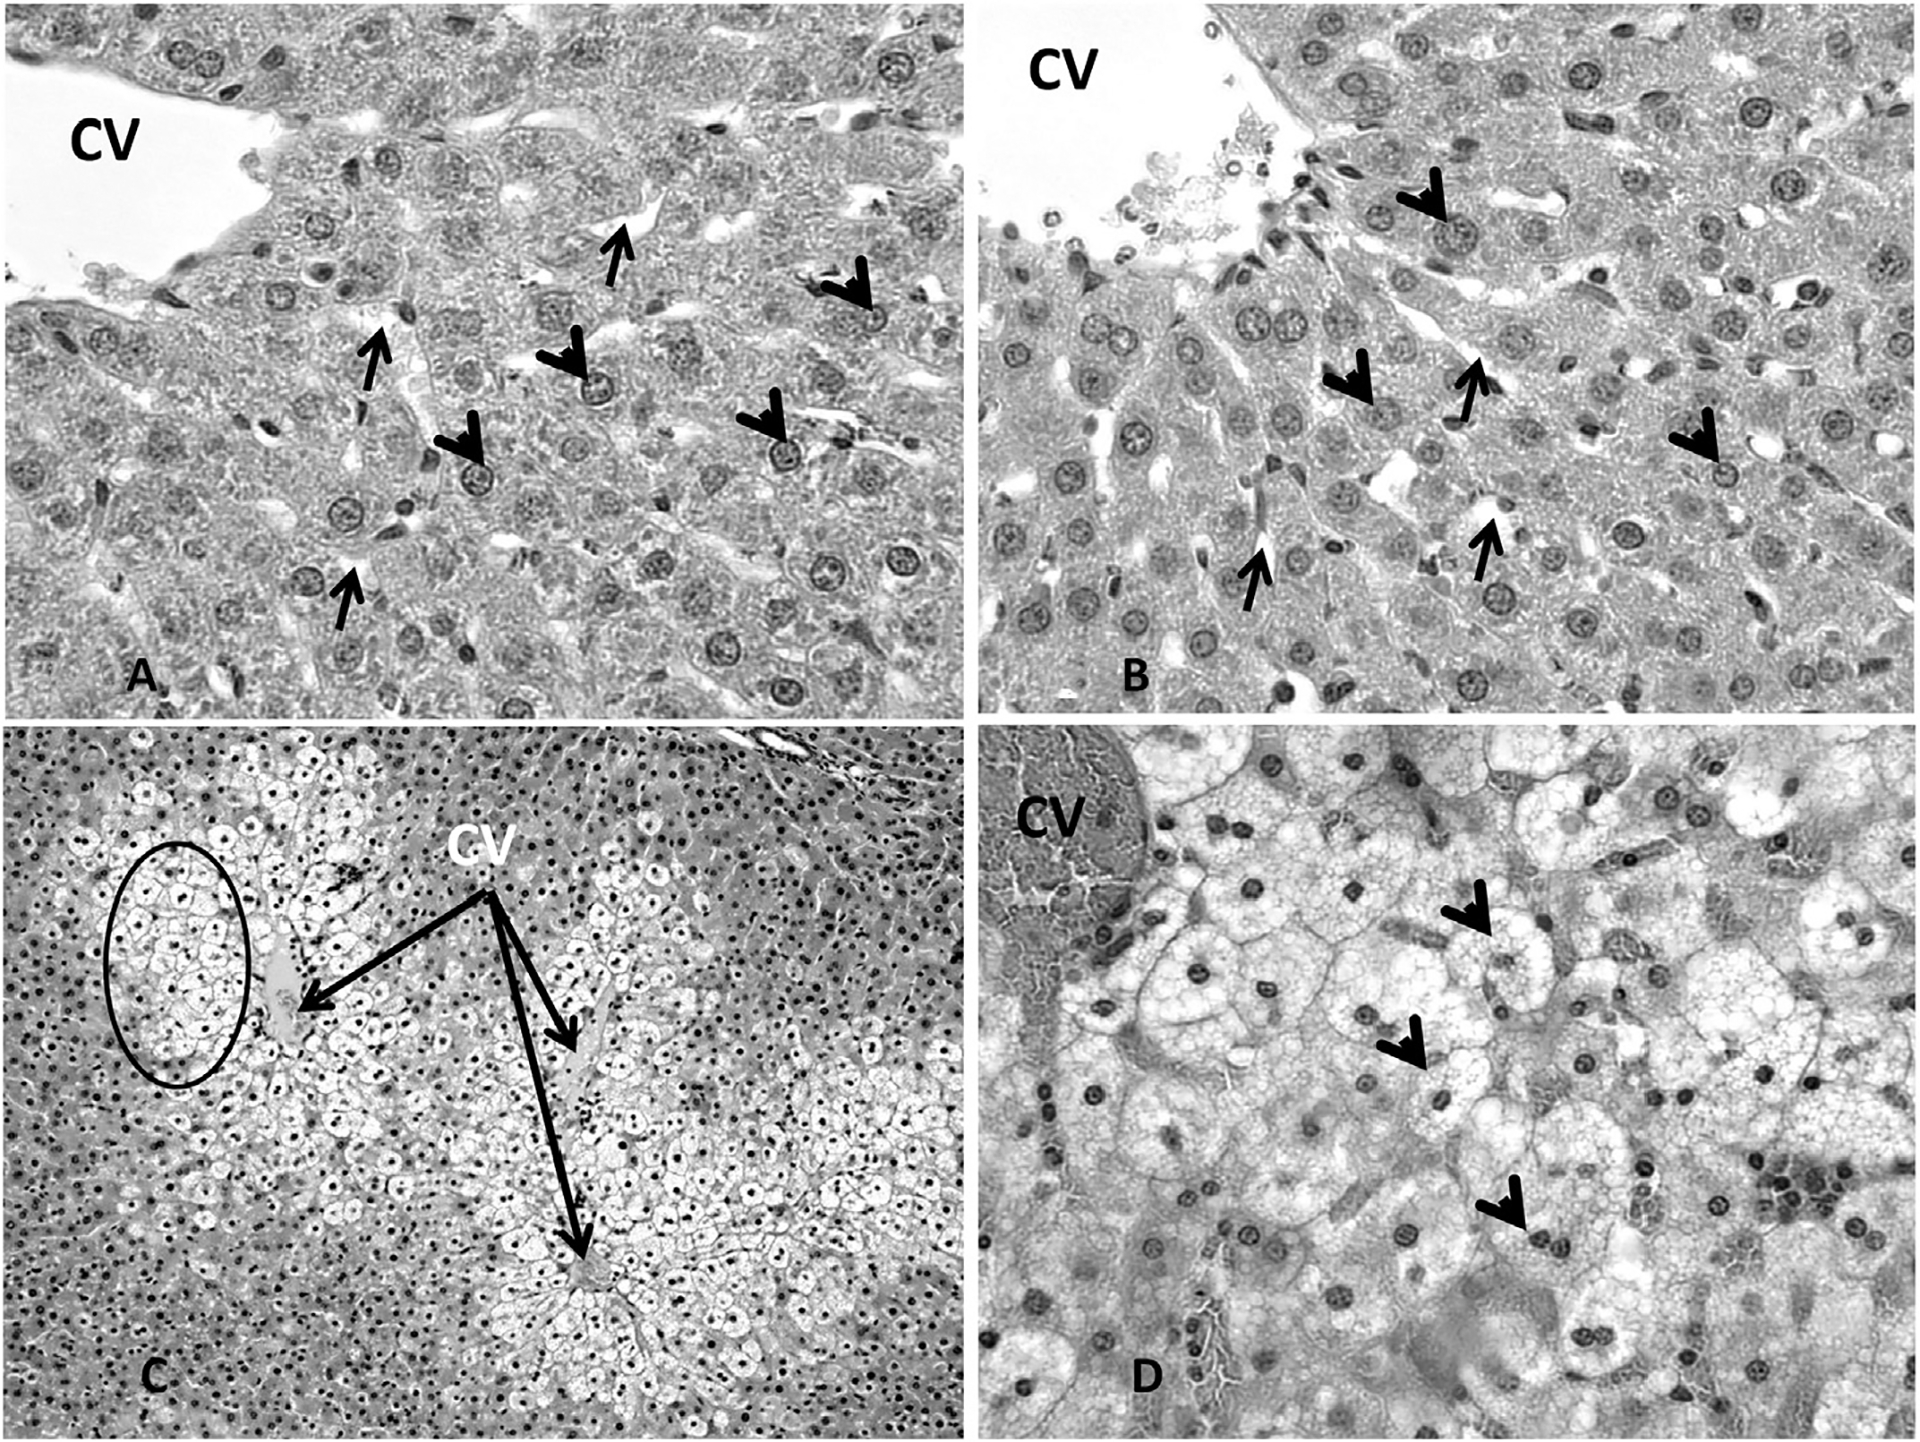
Representative photomicrographs showing sinusoids (arrows), healthy hepatocytes (arrowheads) and the central vein (cv) in the liver of the control group animals (Fig. 3A, 400×) and animals exposed to DGA at concentrations up to and including 100 mg/kg bw (Fig. 3B, 400×). Marked effects were observed in liver histology in animals from the 300 mg/kg dose group throughout the liver (Fig. 3C, 100×). These effects included including microvesicular centrilobular vacuolization (arrowheads) in the liver (3D, 400×).
Fig. 4.

Photomicrograph representative of thymic histology in the control and animals exposed to DGA at concentrations up to and including 100 mg/kg bw (Fig. 4A, 100×). The cortex (C), medulla (M) and trabeculae (T) are clearly delineated. The thymus of experimental animals exposed to 300 mg/kg bw DGA showed a marked reduction in the size of the cortical (C) and medullary (M) areas caused by necrosis and decreased numbers of cortical lymphocytes (Fig. 4B, 100×).
Fig. 5.

Photomicrograph representative of spleen histology in the control group and animals exposed to DGA at concentrations up to and including 100 mg/kg bw (Fig. 5A, 200×). Portions of both the white pulp (W) with the central artery (ca) and red pulp (R) are shown (Fig. 5A). A depletion of white pulp lymphocytes (W) was observed in the spleen of animals exposed to DGA at a concentration of 300 mg/kg bw (Fig. 5B, 200×).
Fig. 6.

Representative photomicrographs (Fig. 6A, 200×; 6B, 400×) of the stomach from the control animals and animals exposed to DGA up to and including 100 mg/kg body weight. Note the intact gastric mucosa, parietal cells and gastric pits. Animals exposed to DGA at a concentration of 300 mg/kg bw (Fig. 6C, 200× and 6D, 400×) show marked vacuolization (arrows) of the lining epithelium of the gastric pits.
Fig. 7.
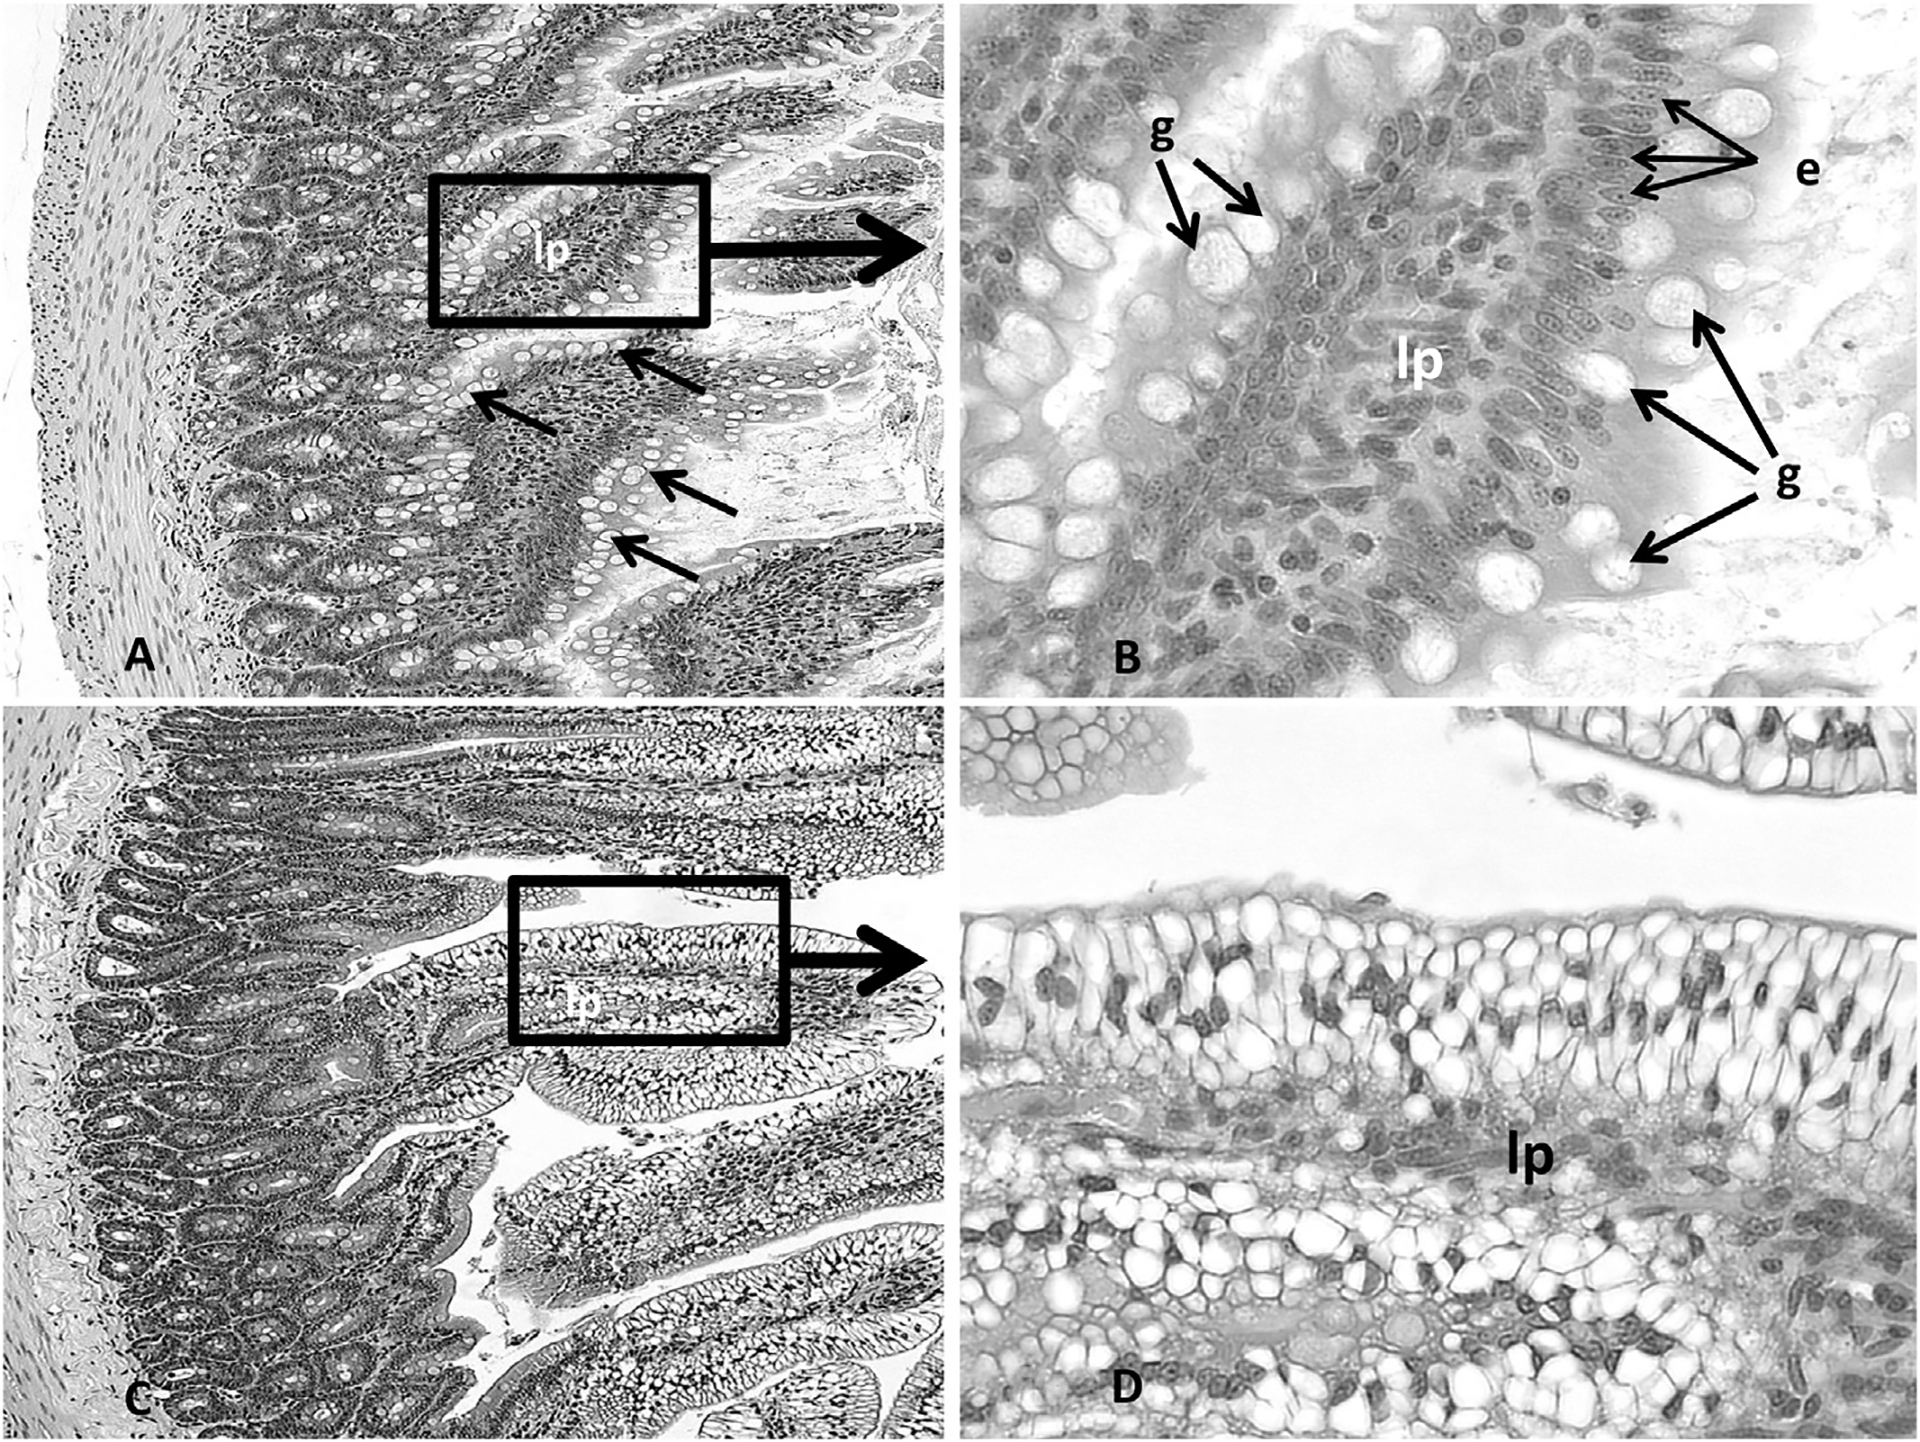
Representative photomicrographs (Fig. 7A, 200×; Fig. 7B, 400×) of the intestine from the control animals and animals exposed to DGA at concentrations up to and including 100 mg/kg body weight. Note the intact lamina propria (lp), goblet cells (g) and columnar epithelium (e) lining the villi. The animals exposed to 300 mg/kg bw DGA showed a marked vacuolization of the epithelial cells lining the intestinal villi (Fig. 7C, 200× and 7D, 400×).
Fig. 8.

Representative photomicrographs (Fig. 8A, 100×; 8B, 400×) of sternal bone marrow from control animals and animals exposed to DGA up to and including 100 mg/kg bw. Note the trabeculae (t, Fig. 8A) and adipose (arrows) dispersed throughout the marrow among the hematopoetic cells. At higher magnification (Fig. 8B) numerous megakaryocytes (arrows) are observed. Animals exposed to DGA at 300 mg/kg bw (Fig. 8C, 100×; 8D, 400×) presented, qualitatively, not only with a decreased number of hematopoietic cells (S), adipose and megakaryocytes (arrows) but also an increase in the prominence of reticular stroma (arrow head) within the sternal bone marrow (Fig. 8D).
3.4. Serum chemistry
Table 3 shows the average values for several blood chemistry parameters, including alkaline phosphatase (ALKP), alanine aminotransferase (ALT), aspartate aminotransferase (AST), creatine kinase (CK), total bilirubin (TBIL), blood urea nitrogen (BUN), creatinine (CREA), glucose (GLU) and uric acid (URIC) levels. These measurements were performed on serum obtained on Day 28 from animals in Groups 1 through 7 (dosed with 0–100 mg/kg bw DGA) and serum taken on Day 5 from animals in Group 8 (dosed with 300 mg/kg bw DGA). Serum parameters were significantly different from control values only in Group 8 after 5 days of exposure and included statistically significant increases in AST (84.25 ± 11.19 vs. 467.88 ± 68.72), CK (97.25 ± 21.65 vs. 204.75 ± 19.51), BUN (19.00 ± 0.93 vs. 29.75 ± 2.62), CREA (0.35 ± 0.03 vs. 4.06 ± 0.22), and the AST/ALT ratios (1.82 ± 0.20 vs. 10.89 ± 3.30) when compared to control values, respectively. Statistically significant decreases were observed for GLU (407.00 ± 29.36 vs. 113.62 ± 16.82), URIC (6.10 ± 0.51 vs. 2.60 ± 0.16) and the BUN/CREA ratio (58.33 ± 7.91 vs. 7.28 ± 0.40) when compared to control values, respectively (Table 3). Serum parameters in all other dose groups were not significantly different from the control groups after 28 days of exposure to DGA.
Table 3.
Serum chemistry analyses (units/ml ± SEM) for Group 1–7 animals (n = 8/group) exposed to DGA for 28 consecutive days or Group 8 animals (n = 8) exposed to DGA for 5 consecutive days.
| Dose of diglycolic acid in mg/kg bw | ||||||||
|---|---|---|---|---|---|---|---|---|
| 0 | 0.3 | 1.0 | 3.0 | 10.0 | 30.0 | 100.0 | 300.0 | |
| ALKPa | 143.75 ± 8.84 | 169.38 ± 18.35 | 150.88 ± 19.15 | 157.88 ± 13.68 | 151.75 ± 15.25 | 148.12 ± 12.59 | 121.88 ± 9.33 | 114.50 ± 10.82 |
| ALTa | 46.75 ± 3.33 | 57.50 ± 5.95 | 61.38 ± 5.92 | 68.25 ± 11.77 | 60.50 ± 7.10 | 61.62 ± 7.90 | 52.38 ± 7.06 | 55.75 ± 8.55 |
| ASTa | 84.25 ± 11.19 | 91.50 ± 11.11 | 97.50 ± 6.79 | 92.75 ± 23.26 | 74.62 ± 9.20 | 97.25 ± 10.64 | 92.62 ± 9.97 | 467.88 ± 68.72! |
| CKa | 97.25 ± 21.65 | 86.75 ± 8.87 | 107.50 ± 16.11 | 131.50 ± 35.18 | 121.00 ± 26.57 | 107.25 ± 14.74 | 344.88 ± 140.84 | 204.75 ± 19.51$ |
| TBILb | 0.86 ± 0.48 | 0.46 ± 0.07 | 0.49 ± 0.08 | 0.44 ± 0.05 | 0.49 ± 0.06 | 0.39 ± 0.08 | 0.64 ± 0.16 | 0.36 ± 0.12 |
| BUNb | 19.00 ± 0.93 | 18.25 ± 1.06 | 18.12 ± 0.67 | 19.25 ± 1.00 | 17.75 ± 0.70 | 17.25 ± 0.59 | 17.62 ± 0.92 | 29.75 ± 2.62© |
| CREAb | 0.35 ± 0.03 | 0.36 ± 0.02 | 0.34 ± 0.03 | 0.35 ± 0.02 | 0.36 ± 0.03 | 0.36 ± 0.03 | 0.34 ± 0.03 | 4.06 ± 0.22* |
| GLUb | 407.00 ± 29.36 | 322.88 ± 28.30 | 386.75 ± 28.43 | 382.12 ± 43.28 | 417.25 ± 52.25 | 360.12 ± 42.02 | 373.88 ± 37.88 | 113.62 ± 16.82* |
| URICb | 6.10 ± 0.51 | 5.19 ± 0.63 | 6.09 ± 0.60 | 5.65 ± 0.84 | 6.35 ± 0.88 | 5.78 ± 0.74 | 6.40 ± 0.76 | 2.60 ± 0.16* |
| BUN_CREA | 58.33 ± 7.91 | 50.73 ± 2.82 | 57.04 ± 5.78 | 56.04 ± 4.13 | 52.19 ± 6.65 | 50.52 ± 6.07 | 55.29 ± 5.41 | 7.28 ± 0.40* |
| AST_ALT | 1.82 ± 0.20 | 1.70 ± 0.23 | 1.65 ± 0.13 | 1.33 ± 0.14 | 1.25 ± 0.09 | 1.64 ± 0.13 | 1.92 ± 0.24 | 10.89 ± 3.30@ |
Serum chemistry parameters were measured in standard units as follows:
U/L,
mg/dL.
p < 0.1 (p = 0.0512),
p < 0.01 (p = 0.0053),
p < 0.0001;
p < 0.010(p = 0.0079);
p < 0.0005.
3.5. Urine analysis
Urine production was monitored to help ascertain kidney function following exposure to DGA or vehicle control. Urine output ceased in Group 8 animals (300 mg/kg bw) between the 2nd and 4th consecutive days of dosing (Table 4). By contrast, significant differences in urine output were not observed between the control group and any other DGA treatment group (Table 4). Urine samples collected from animals in all cohorts were also evaluated for pH, color, turbidity, nitrite concentration, specific gravity, and protein levels. Whereas animals that received the vehicle control alone (Group 1) or 0.3–30 mg/kg bw range (Groups 2–6) produced urine with pH values in the range of 7.5–8.5 throughout the 28-day study, animals that received DGA at the dose of 100 mg/kg bw (Group 7) produced urine having pH values in the lower range of 7.0–8.0 over the 28-day study. The 300 mg/kg bw DGA dose group (Group 8) produced urine with the lowest pH values (between 7.0 and 7.5) on Day 2 before urine production ceased. Urine color and turbidity were indistinguishable across Groups 1–7 over the course of the study, but those of Group 8 was considerably lighter and less turbid on Day 2 than in any other treatment or control group. Urine nitrite levels trended lowest in Groups 1–6 (ranging from 0 to 0.6 arbitrary units) and highest in Groups 7 and 8 (ranging from 0.5 to 1.2 arbitrary units). Clear trends in specific gravity and protein levels were not observed.
Table 4.
Mean volume of urine (ml ± SEM) collected from DGA-treated and control animals while in metabolism cages at the specified time points.
| DGA dose (mg/kg bw) | Exposure day | ||||
|---|---|---|---|---|---|
| 2 | 4 | 8 | 16 | 22 | |
| 0 | 8.9 ± 2.8 | 8.2 ± 2.0 | 11.5 ± 2.6 | 11.6 ± 2.7 | 12.5 ± 1.8 |
| 0.3 | 7.3 ± 0.7 | 9.2 ± 1.0 | 9.1 ± 1.4 | 10.4 ± 1.0 | 11.4 ± 1.3 |
| 1 | 6.4 ± 1.4 | 7.4 ± 0.8 | 8.3 ± 1.4 | 10.5 ± 1.5 | 11.3 ± 1.3 |
| 3 | 8.1 ± 0.9 | 9.9 ± 1.6 | 11.1 ± 0.8 | 11.9 ± 1.2 | 12.7 ± 1.9 |
| 10 | 7.7 ± 1.6 | 11.8 ± 2.5 | 12.1 ± 2.8 | 15.0 ± 3.0 | 12.1 ± 1.8 |
| 30 | 8.0 ± 1.1 | 7.9 ± 1.0 | 8.3 ± 1.0 | 9.4 ± 1.3 | 9.4 ± 1.3 |
| 100 | 9.6 ± 1.8 | 10.6 ± 2.1 | 10.1 ± 1.6 | 12.7 ± 2.6 | 15.1 ± 2.3 |
| 300 | 8.9 ± 3.1 | NA | NA | NA | NA |
NA: Not applicable; animals moribund and were euthanized on Day 5.
4. Discussion
The widespread use of carboxymethyl starches raises the question of whether the presence of DGA as an inseparable byproduct following carboxymethyl starch synthesis (Koschella et al., 2011) is a concern. DGA is a metabolite of DEG (diethylene glycol). DEG, which when used to adulterate drug products, has been shown to induce renal injury (Schep et al., 2009). The study described herein was designed to acquire dose-response relationship information on DGA and identify target organs of toxicity. Groups of female nulliparous Sprague Dawley rats received a single daily dose of DGA for 28 consecutive days. Treatment doses of 0–30 mg/kg bw neither affected the animals at the macroscopic nor microscopic levels. Increasing the treatment dose to 100 mg/kg bw induced some relatively mild kidney effects, while the highest dose of 300 mg/kg bw triggered a cascade of severe renal and liver effects that set in within just 5 days of daily exposure in the rat.
The toxic effects observed in the 300 mg/kg bw DGA exposure group included reduced feed consumption concomitant with a reduced fluid consumption, lethargy and marked signs of dehydration. Significant reductions in animal body weight and urine production were observed within the first 5 days of treatment. At necropsy, the kidneys and livers of animals collected by day 5 of exposure from the 300 mg/kg dose group were found to not only be significantly enlarged but also paler than the same organs in the other dose groups collected after 28 days of DGA exposure. The livers from the 300 mg/kg bw dose group were also mottled. Consistently, the kidney and liver weights from the animals in the 300 mg/kg bw dose group were also significantly increased. Histopathological examination of the kidneys and livers of these high dose treated animals revealed proximal tubule epithelial cell cytoplasmic vacuolar degeneration as well as renal tubular necrosis and hepatocyte centrilobular cytoplasmic vacuolization. These observations are consistent with effects reported for an unintentional human exposure case report (Roscher et al., 1975).
The dramatic shift in observed toxicity between the 100 and 300 mg/kg bw cohorts allowed for comparisons between these two groups to be made. Regenerative changes were observed in both the 100 and 300 mg/kg bw dose groups. These signs of regeneration were observed in the proximal tubules of the cortex in the 100 mg/kg bw dose group. The renal damage, observed only at the highest dose groups, was dose related and the incidence of damage dramatically increased in severity from the 100 mg/kg to the 300 mg/kg dose group. Other findings included a squamous cell papilloma of the nonglandular stomach in one of the animals from the 30 mg/kg dose group, and renal nephroblastematosis in the kidney of one animal from the 1.0 mg/kg dose group, however, these did not appear to be related to DGA exposure. Squamous cell papillomas are frequently observed in gavage studies and nephroblastematoses are encountered sporadically in rats. Hepatic changes were limited only to the livers of high dose animals and were consistent with steatosis of the centrilobular hepatocytes as well as with those speculated to be caused by metabolic acidosis in DEG-treated rats previously described (Besenhofer et al., 2011). In addition, thymic (thymic cortical lymphoid necrosis), gastric (cytoplasmic vacuolization of the glandular stomach epithelium), intestinal (cytoplasmic vacuolization of the duodenal epithelium), colonic (edema), splenic (lymphoid necrosis within germinal centers, marginal zone lymphatic loses and a decrease in size of the white pulp) and atrophic changes in the sternal and femoral bone marrow were observed only in the high dose exposure group. These comparative findings between the 100 and 300 mg/kg bw dose groups not only indicate that the body is capable of launching regenerative processes to help reverse DGA toxicity, but that there is a threshold level past which counter measures are not effective to avoid renal damage. A recent paper by Robinson et al. (2017) has shown that DGA rapidly accumulates in both the kidneys and liver and their findings in male Wistar rats parallel our findings in female Sprague Dawley rats and suggest that there is a very steep dose response curve at the higher exposure levels, specifically between 100 and 300 mg/kg bw, and “a saturable step that results in DGA accumulation in target organs.” (Robinson et al., 2017). These findings taken together suggest that the adverse effect associated with DGA exposure does not appear to be sex specific but rather concentration dependent.
The renal shutdown that occurred following daily DGA exposure at the 300 mg/kg bw dose tested was accompanied by significant changes in several blood biomarkers of both renal and hepatic damage exclusively in this treatment cohort. Namely, BUN and CREA levels observed in this maximum dose group were 1.5- and 11.6-fold elevated over those from the vehicle control group, respectively. These findings suggested that a reduction in renal function (Bagshaw and Gibney, 2008) was occurring within merely 5 days of daily DGA exposure in the rat. The elevated BUN and creatinine levels were probably induced as a consequence of dehydration, since urine output did cease in the highest dose group. Further urine analyses also indicated a polyuric state of prerenal failure, as the lack of urine output was preceded by the observation that urine was abnormally pale yellow in color (Callens and Bartges, 2015).
In addition to the severe damage incurred by the kidneys, injury to the liver was also measured. According to the analysis of blood biomarkers, there was a significant increase in the average AST values exclusively in animals given the 300 mg/kg bw treatment. This approximate 5-fold increase over control levels indicated the presence of liver damage (Pratt and Kaplan, 2000), which was consistent with histopathological findings. Other serum chemistry markers of liver injury were not significantly elevated in this highest dose group. This finding may reflect the possibility that hepatocytes of these livers had passed a point of injury that simply prevented the expected robust expression of biomarkers like ALKP, TBIL, and ALT that are often measured in situations of progressive hepatotoxicity. This possibility, in turn, would suggest that the approximate 5-fold increase in AST values in this group would be perhaps more reflective of general myopathy in these animals, since AST is highly expressed in heart and skeletal muscle tissues (Burtis et al., 2008). Indeed, the average 2-fold increase in CK levels in this maximum dose group was suggestive of muscle weakness (Brancaccio et al., 2010), which may help explain the overall lethargy observed in this animal cohort. Nevertheless, the liver injury observed upon gross organ and microscopic histopathological analyses ultimately provide unambiguous evidence of severe liver injury.
In summary, the data in this study points to DGA possessing a type of dose-response relationship that seems to induce no obvious toxic response at the relatively low levels of 0.3–30 mg/kg bw, a minor toxic response at the 100 mg/kg bw dose, and a strikingly toxic and lethal response at the maximum tested dose of 300 mg/kg bw in the rat. It is not clear, however, how this pattern of response would extrapolate to the human setting.
Footnotes
Transparency document
Transparency document related to this article can be found online at http://dx.doi.org/10.1016/j.fct.2017.03.047.
The views expressed in this article are those of the author(s) and may not reflect the official policy of the Department of Health and Human Services, the U.S. Food and Drug Administration, or the U.S. Government.
References
- Bagshaw SM, Gibney RTN, 2008. Conventional markers of kidney function. Crit. Care Med 36, S152–S158. [DOI] [PubMed] [Google Scholar]
- Besenhofer LM, McLaren MC, Latimer B, Bartels M, Filary MJ, Perala AW, McMartin KE, 2011. Role of tissue metabolite accumulation in the renal toxicity of diethylene glycol. Toxicol. Sci. Off. J. Soc. Toxicol 123, 374–383. [DOI] [PubMed] [Google Scholar]
- Bowie MD, McKenzie D, 1972. Diethylene glycol poisoning in children. South Afr. Med. J. Suid Afr. Tydskr. Vir. Geneeskd 46, 931–934. [PubMed] [Google Scholar]
- Brancaccio P, Lippi G, Maffulli N, 2010. Biochemical markers of muscular damage. Clin. Chem. Lab. Med 48, 757–767. [DOI] [PubMed] [Google Scholar]
- Burtis CA, Ashwood ER, Bruns DE, Sawyer BG, 2008. Tietz Fundamentals of Clinical Chemistry. Saunders Elsevier. [Google Scholar]
- Callens AJ, Bartges JW, 2015. Urinalysis. Vet. Clin. North Am. Small Anim. Pract 45, 621–637. [DOI] [PubMed] [Google Scholar]
- Cantarell MC, Fort J, Camps J, Sans M, Piera L, 1987. Acute intoxication due to topical application of diethylene glycol. Ann. Intern. Med 106, 478–479. [DOI] [PubMed] [Google Scholar]
- Drut R, Quijano G, Jones MC, Scanferla P, 1994. Pathologic findings in diethylene glycol poisoning. Med. Mex 54, 1–5. [PubMed] [Google Scholar]
- Ferrari LA, Giannuzzi L, 2005. Clinical parameters, postmortem analysis and estimation of lethal dose in victims of a massive intoxication with diethylene glycol. Forensic Sci. Int 153, 45–51. [DOI] [PubMed] [Google Scholar]
- Hanif M, Mobarak MR, Ronan A, Rahman D, Donovan JJ, Bennish ML, 1995. Fatal renal failure caused by diethylene glycol in paracetamol elixir: the Bangladesh epidemic. BMJ 311, 88–91. [DOI] [PMC free article] [PubMed] [Google Scholar]
- Herbert JL, Fabre M, Auzépy P, Paillas J, 1978. Acute experimental poisoning by diethylene glycol: acid base balance and histological data in male rats. Toxicol. Eur. Res. Rech. Eur. En. Toxicol 1, 2890–2894. [PubMed] [Google Scholar]
- Keltner Z, Olejnik N, Stine C, Evans E, Mossoba M, Vohra S, Toomer H, Sprando J, Topping V, Belgrave K, DePina A, Black T, Sprando R, 2015. Acute renal toxicity induced by oral exposure to diglycolic acid. Toxicol. 144 (1). ISSN; 1096,−6080, March 2015. [Google Scholar]
- Koschella A, Hartlieb M, Heinze T, 2011. A “click-chemistry” approach to cellulose-based hydrogels. Carbohydr. Polym 86, 154–161. [Google Scholar]
- Landry GM, Martin S, McMartin KE, 2011. Diglycolic acid is the nephrotoxic metabolite in diethylene glycol poisoning inducing necrosis in human proximal tubule cells in vitro. Toxicol. Sci. Off. J. Soc. Toxicol 124, 35–44. [DOI] [PubMed] [Google Scholar]
- Mossoba M, Keltner Z, Black T, Olejnik N, DePina A, Belgrave K, Topping V, Wiesenfeld P, Sprando J, Vohra S, Toomer H, Sprando R, 2015. Acute renal toxicity to diglycolic acid: preliminary findings of an in vitro-to-in vivo comparison. Toxicol. 144 (1). ISSN; 1096,−6080, March 2015. [Google Scholar]
- Mossoba ME, Vohra S, Toomer H, Pugh-Bishop S, Keltner Z, Topping V, Black T, Olejnik N, Depina A, Belgrave K, et al. , 2017. In Vitro Exposure of Diglycolic Acid to Human Proximal Tubule Cells Models Acute In Vivo Nephrotoxicity (Submitted). [DOI] [PMC free article] [PubMed]
- Okuonghae HO, Ighogboja IS, Lawson JO, Nwana EJ, 1992. Diethylene glycol poisoning in Nigerian children. Ann. Trop. Paediatr 12, 235–238. [DOI] [PubMed] [Google Scholar]
- Pandya SK, 1988. Letter from Bombay. An unmitigated tragedy. BMJ; 297, 117–119. [DOI] [PMC free article] [PubMed] [Google Scholar]
- Pratt DS, Kaplan MM, 2000. Evaluation of abnormal liver-enzyme results in asymptomatic patients. N. Engl. J. Med 342, 1266–1271. [DOI] [PubMed] [Google Scholar]
- Robinson CN, Latimer B, Abreo F, Broussard K, McMartin KE, 2017. In-vivo evidence of nephrotoxicity and altered hepatic function in rats following administration of diglycolic acid, a metabolite of diethylene glycol, 2017 Mar Clin. Toxicol. Phila 55 (3), 196–205. 10.1080/15563650.2016.1271128. Epub 2017 Jan 11. [DOI] [PubMed] [Google Scholar]
- Roscher AA, Jussek E, Noguchi T, Franklin S, 1975. Fatal accidental diglycolic acid intoxication. Toxicol. Pathol 3, 3–13. [Google Scholar]
- Schep LJ, Slaughter RJ, Temple WA, Beasley DMG, 2009. Diethylene glycol poisoning. Clin. Toxicol. Phila. Pa 47, 525–535. [DOI] [PubMed] [Google Scholar]