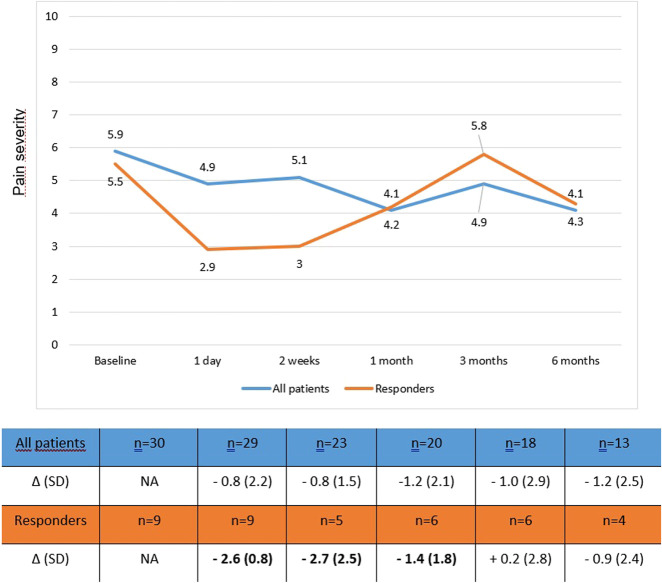
Figure 3.
Long-term effect on pain after lidocaine infusion in responders versus all patients. Numbers in the graph indicate the mean BPI pain severity scores at the different time points. Responders are patients with a clinically relevant reduction in pain severity (defined as Δ ≥ 1.3). Bold numbers in the table indicate a clinically relevant difference.

