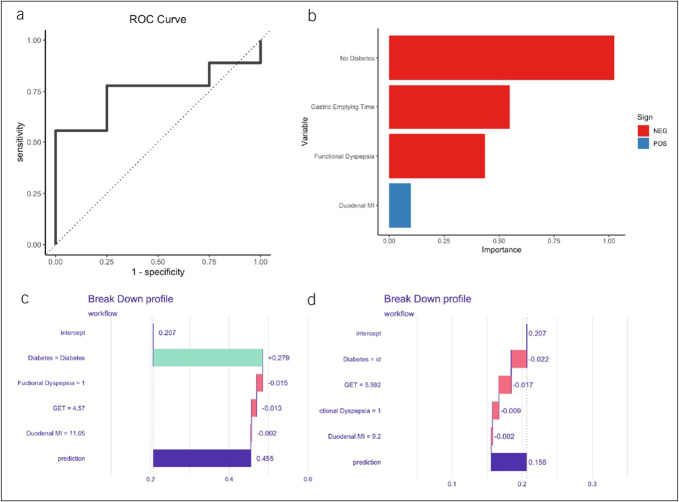
Figure 5.
(a) ROC curve with predictor variables derived from those on neuromodulator without prokinetics. (b) VIP of the model. Breakdown plot for subjects with (c) high and (d) low predicted probability for response to neuromodulators without prokinetics. ROC, receiver operator characteristic curve; GET, gastric emptying time; id, idiopathic; MI, motility index; VIP, variable importance plot.

