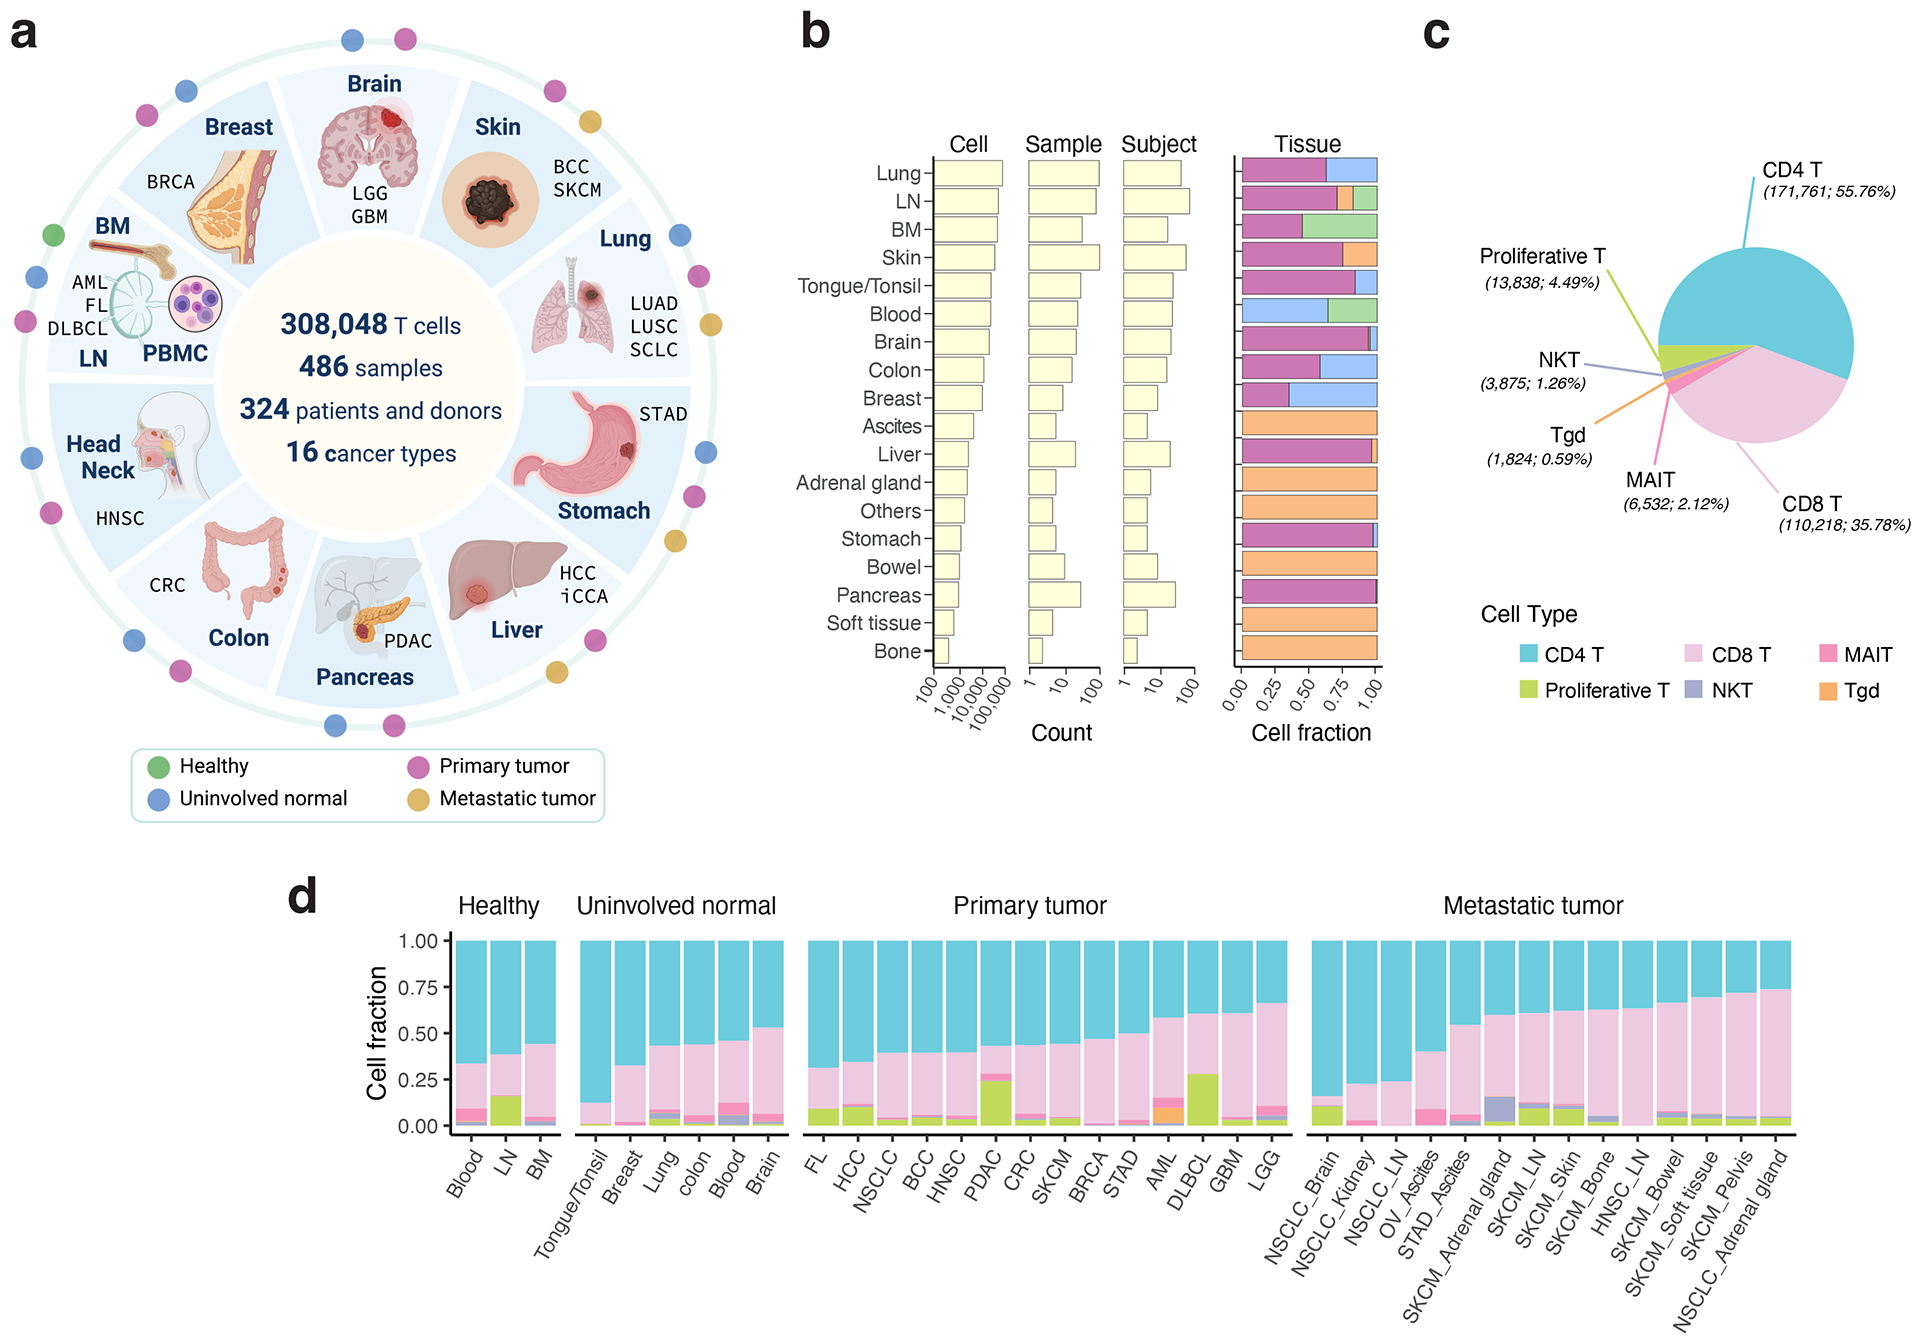
Figure 1. Pan-cancer analysis of T cells - data collection and major T cell types.

a) Schematic depicting the study design (created with BioRender.com). We used 17 published and 10 in-house datasets. Detailed information on cohorts and samples is provided in Supplementary Tables 1 and 2. b) Bar graphs showing summary statistics for the number of cells, samples, and subjects collected by organ (left) and their tissue compositions (right). Tissue color codes are consistent with panel a. c) Pie chart depicting the cellular frequencies of the 6 major T cell types in all analyzed samples. d) Bar graphs displaying relative cellular fractions of the 6 major T cell types across various cohorts of the four main tissue groups. In our study, the analyzed metastatic tumors were biopsies taken from metastases. BM, bone marrow; LN, lymph node; PBMC, peripheral blood mononuclear cell. For uninvolved normal tissues and metastatic tumors, their corresponding organs/sites of sample collection are labeled. Cancer types are labeled using the TCGA study abbreviations.
