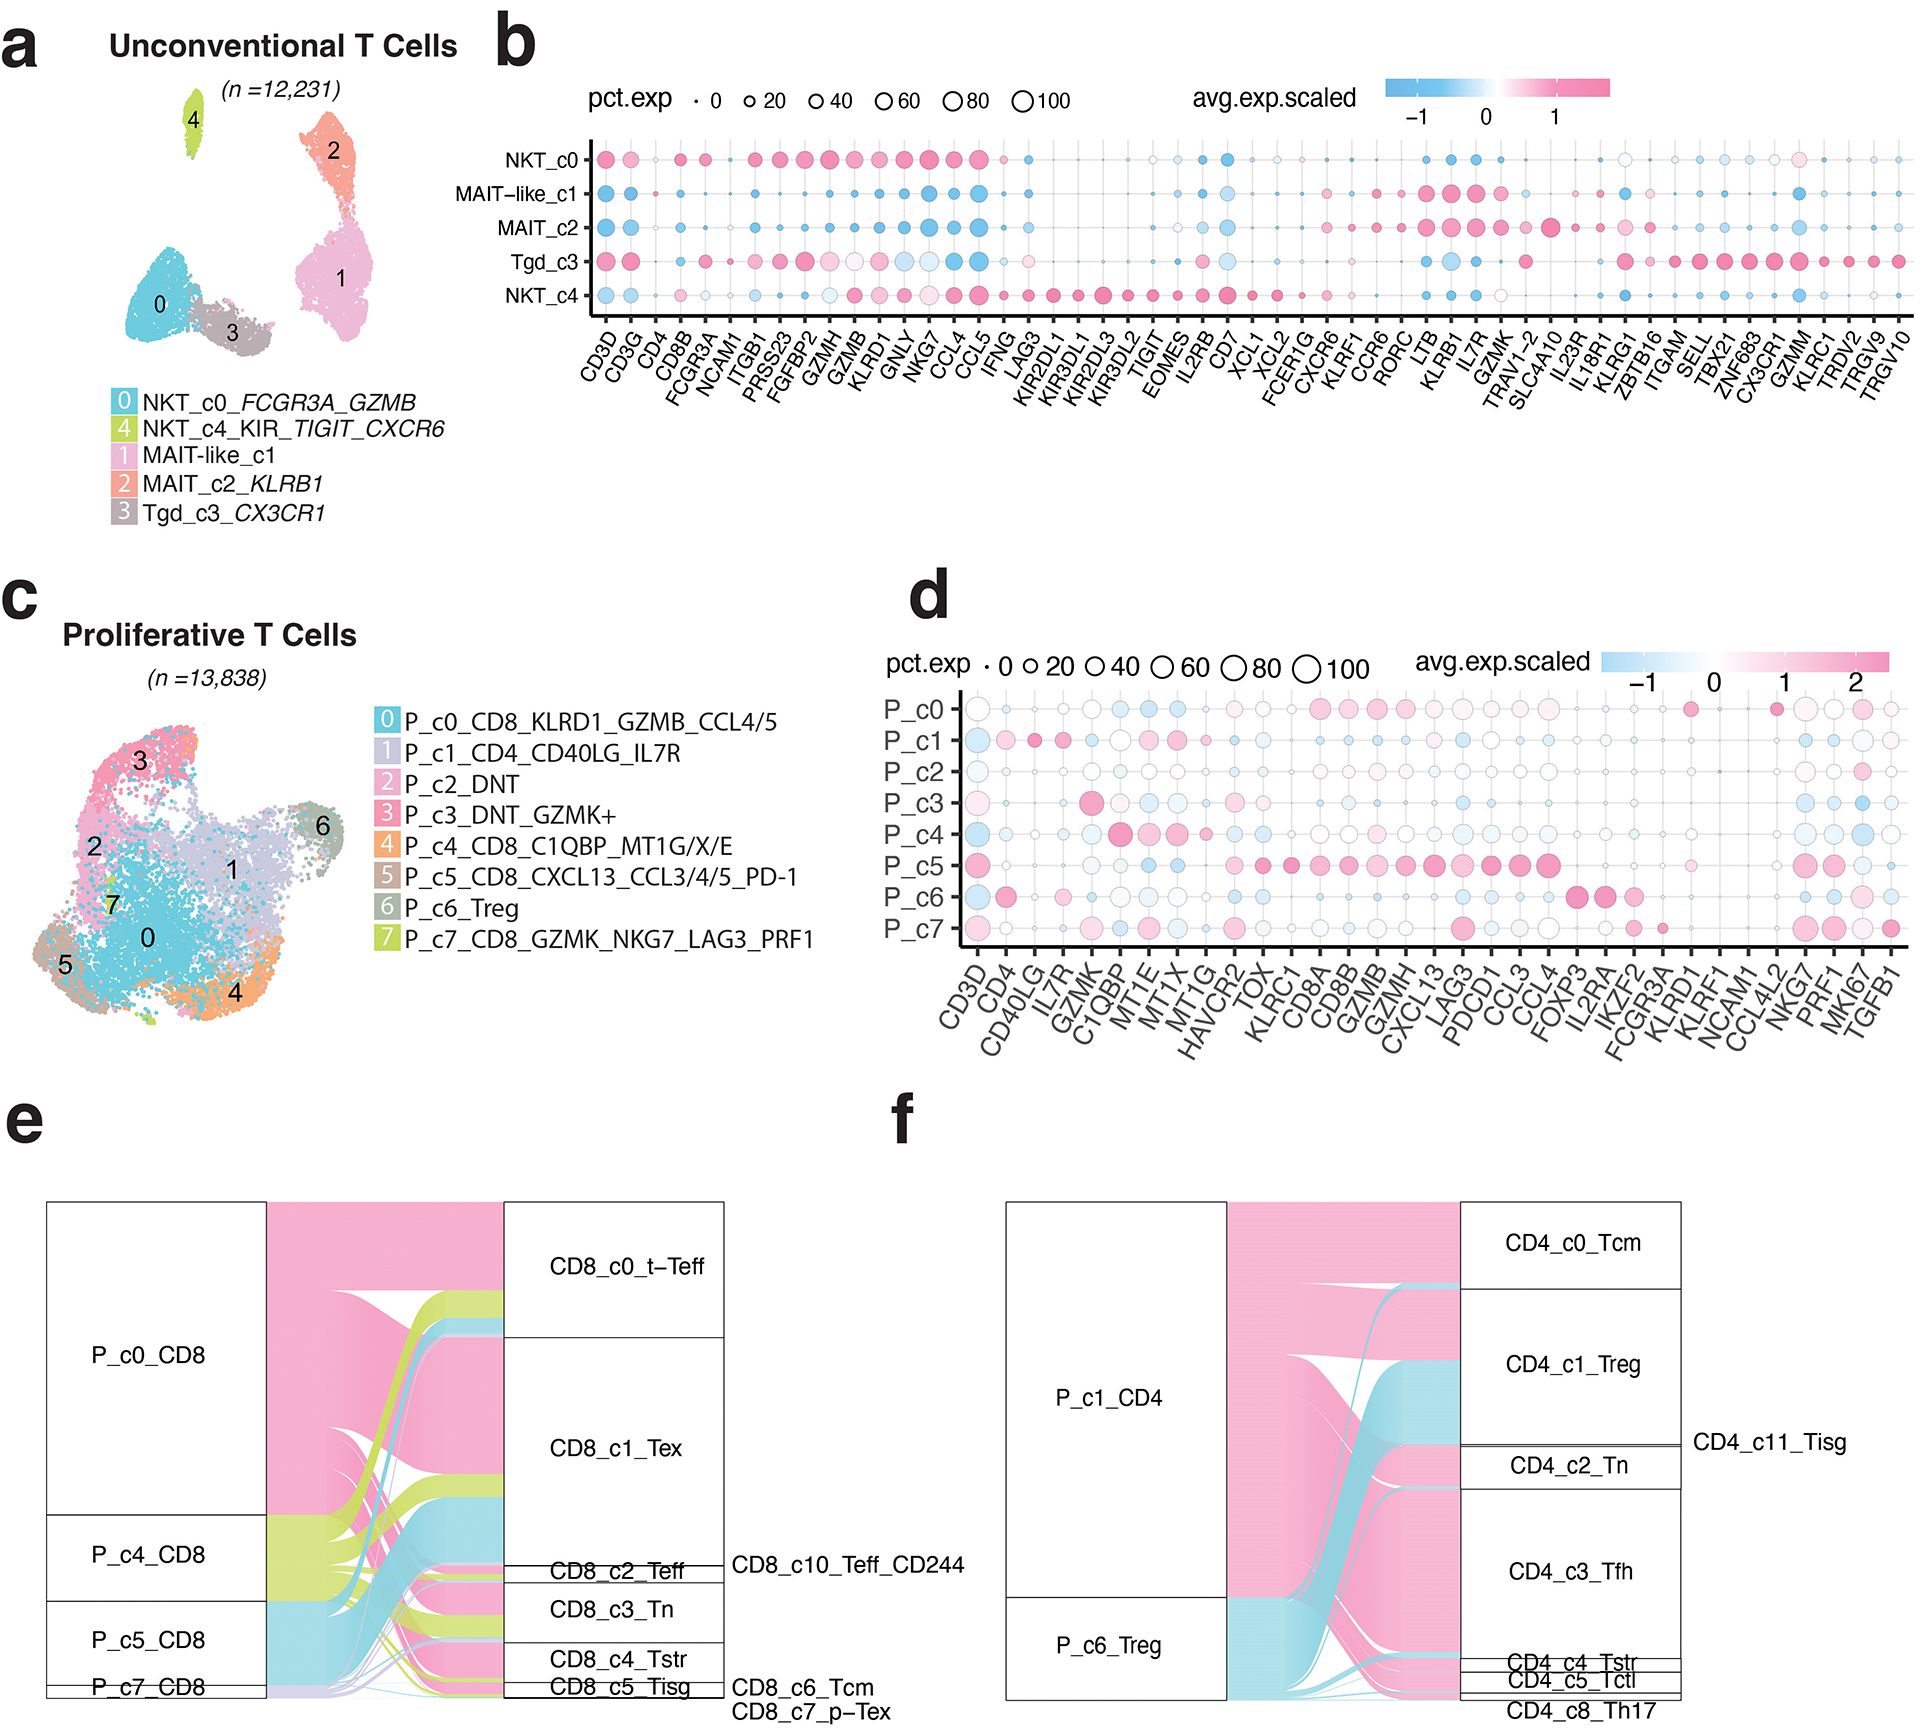
Extended Data Fig. 4. Characterization of unconventional T cells and proliferative T cells.

a) UMAP view of 5 innate T cell clusters. b) Bubble plot showing marker gene expression across 5 innate T cell clusters. The complete list of top 50 most significant DEGs is provided in the Supplementary Table 9. c) UMAP view of 8 proliferative T cell clusters. d) Bubble plot showing marker gene expression across 8 proliferative T cell clusters. The complete list of top 50 most significant DEGs is provided in the Supplementary Table 10. e) Sankey diagram showing the mapping of four proliferative CD8 subsets to the rest of CD8 T cell clusters after regressing out cell proliferative markers. f) Sankey diagram showing the mapping of two proliferative CD4 subsets (P_c6_Treg and P_c1) to the rest of CD4 T cell clusters after regressing out cell proliferative markers.
