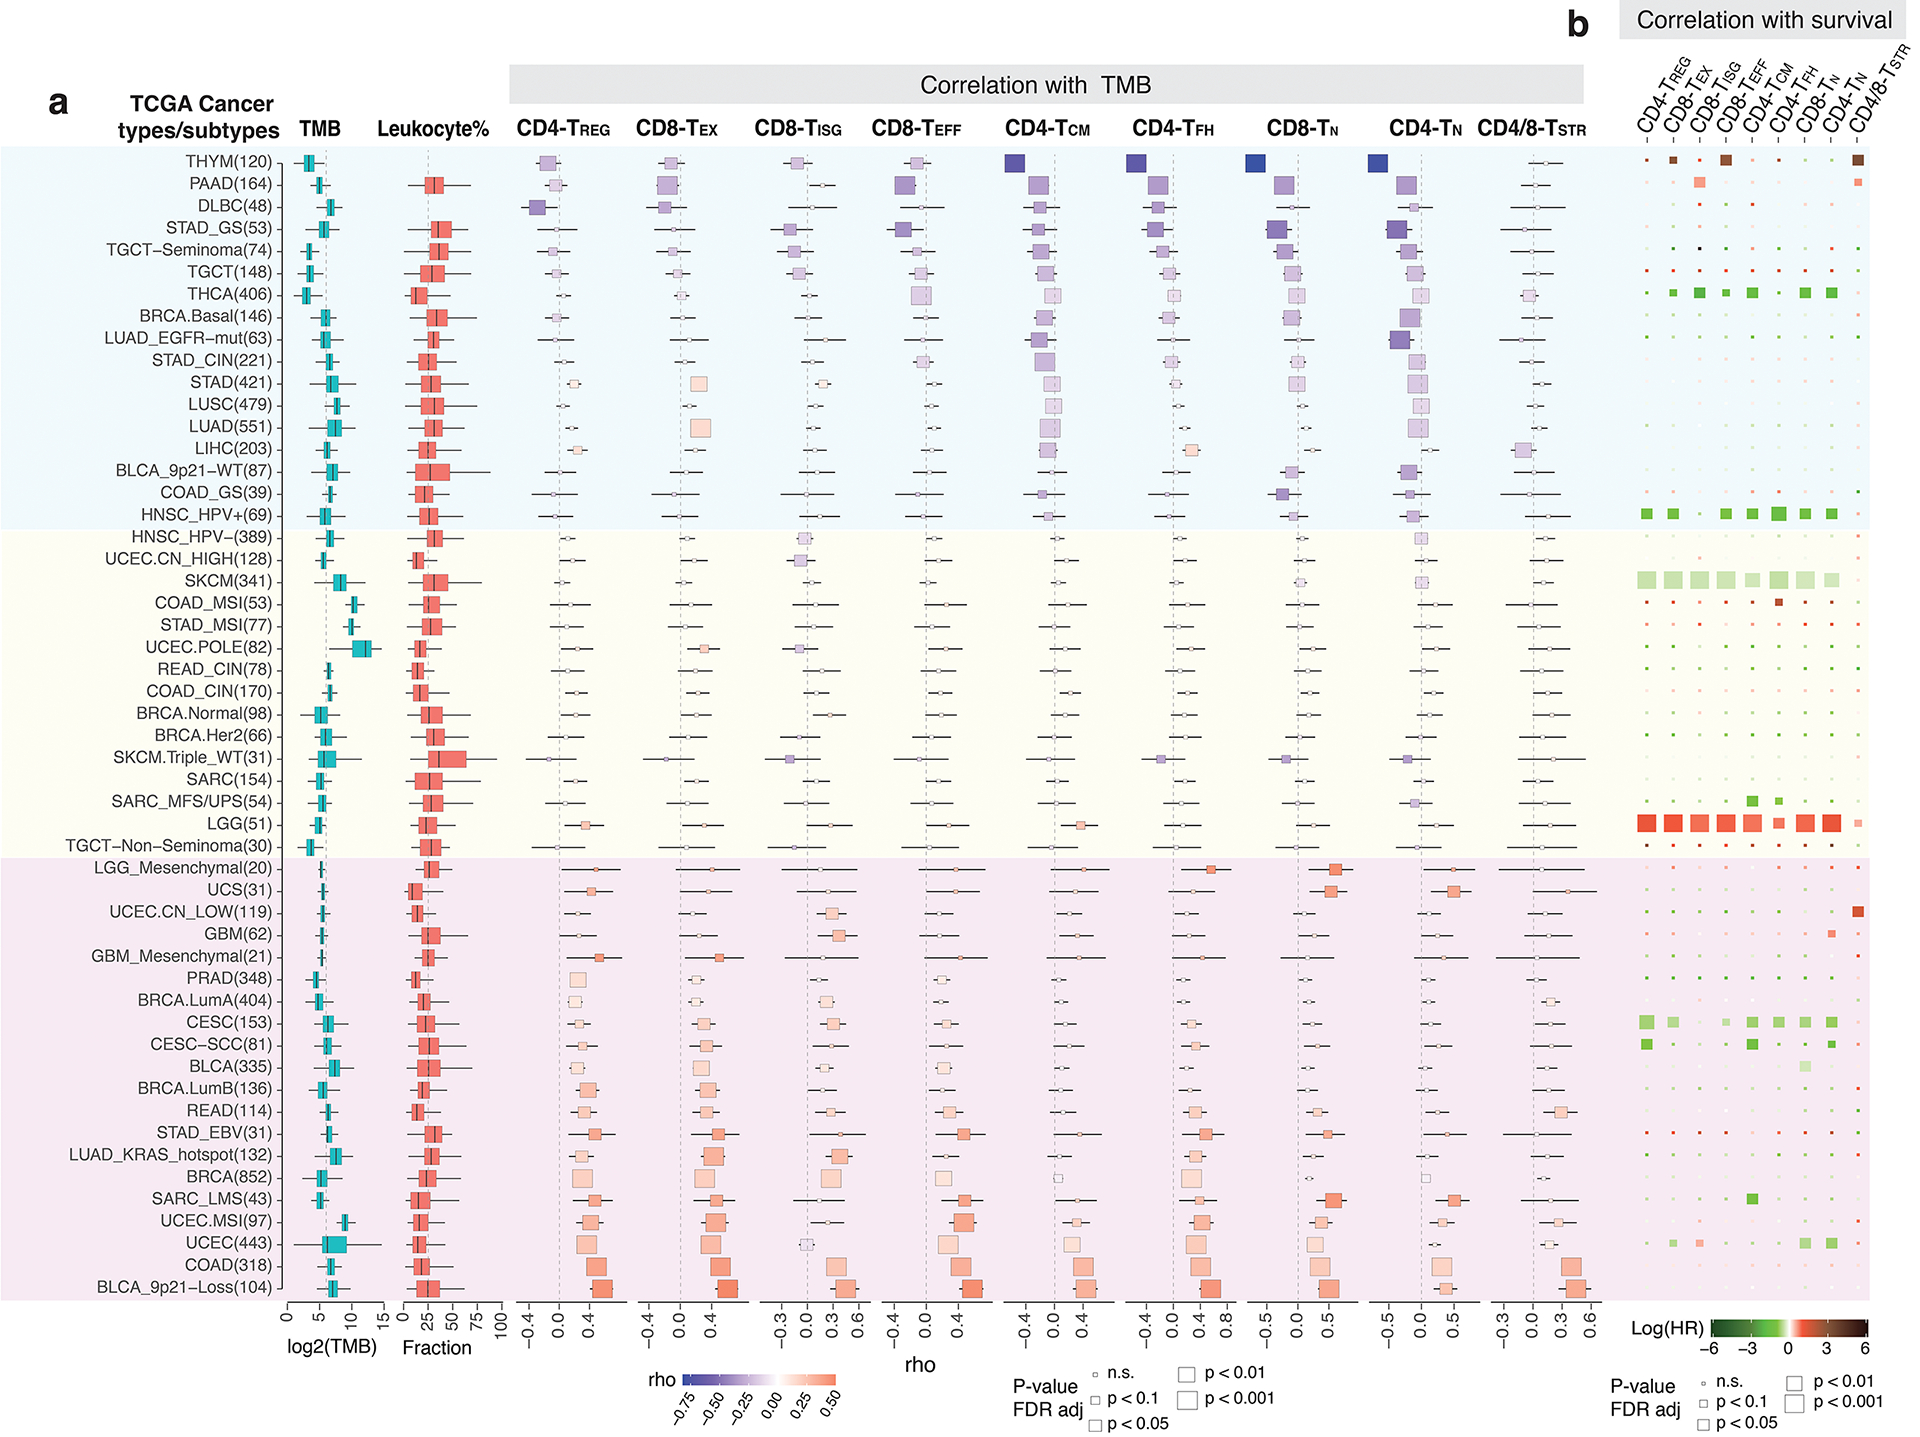
Extended Data Fig. 5. Correlations with tumor mutational burden (TMB) and patient survival in TCGA cohorts.

a) Correlation between the abundance of 9 T cell states (estimated via T cell deconvolution analysis using unique gene signatures in Supplementary Table 12) and TMB across 52 cancer types and their genotypic/molecular subtypes (labeled on the left with numbers indicating sample size). A total of 11,051 TCGA tumors with bulk RNA-seq data available were included and samples with low abundance of T cells (the bottom 25% of the ranked data) as estimated using MCP-counter were excluded (Supplementary Table 13). TMB and leukocyte fractions were from TCGA pan-cancer study by Thorsson et al.77. The annotation of cancer types and their genotypic/molecular subtypes was adopted from our recent study by Han et al. (Nature Communication, 12, 5606, 2021). The size of the rectangle is proportional to statistical significance (p-value, two-sided spearman correlation test, FDR-adjusted) and the color intensity is proportional to Spearman correlation coefficient (rho). Boxes, median ± interquartile range; whiskers, 1.5× interquartile range. b) Correlation with patient overall survival (OS). The size of the rectangle is proportional to statistical significance (FDR-adjusted p-value) and the color intensity is proportional to log scaled hazard ratio (HR).
