
Extended Data Fig. 6. Correlation with patient survival in the CPI1000+ cohorts.
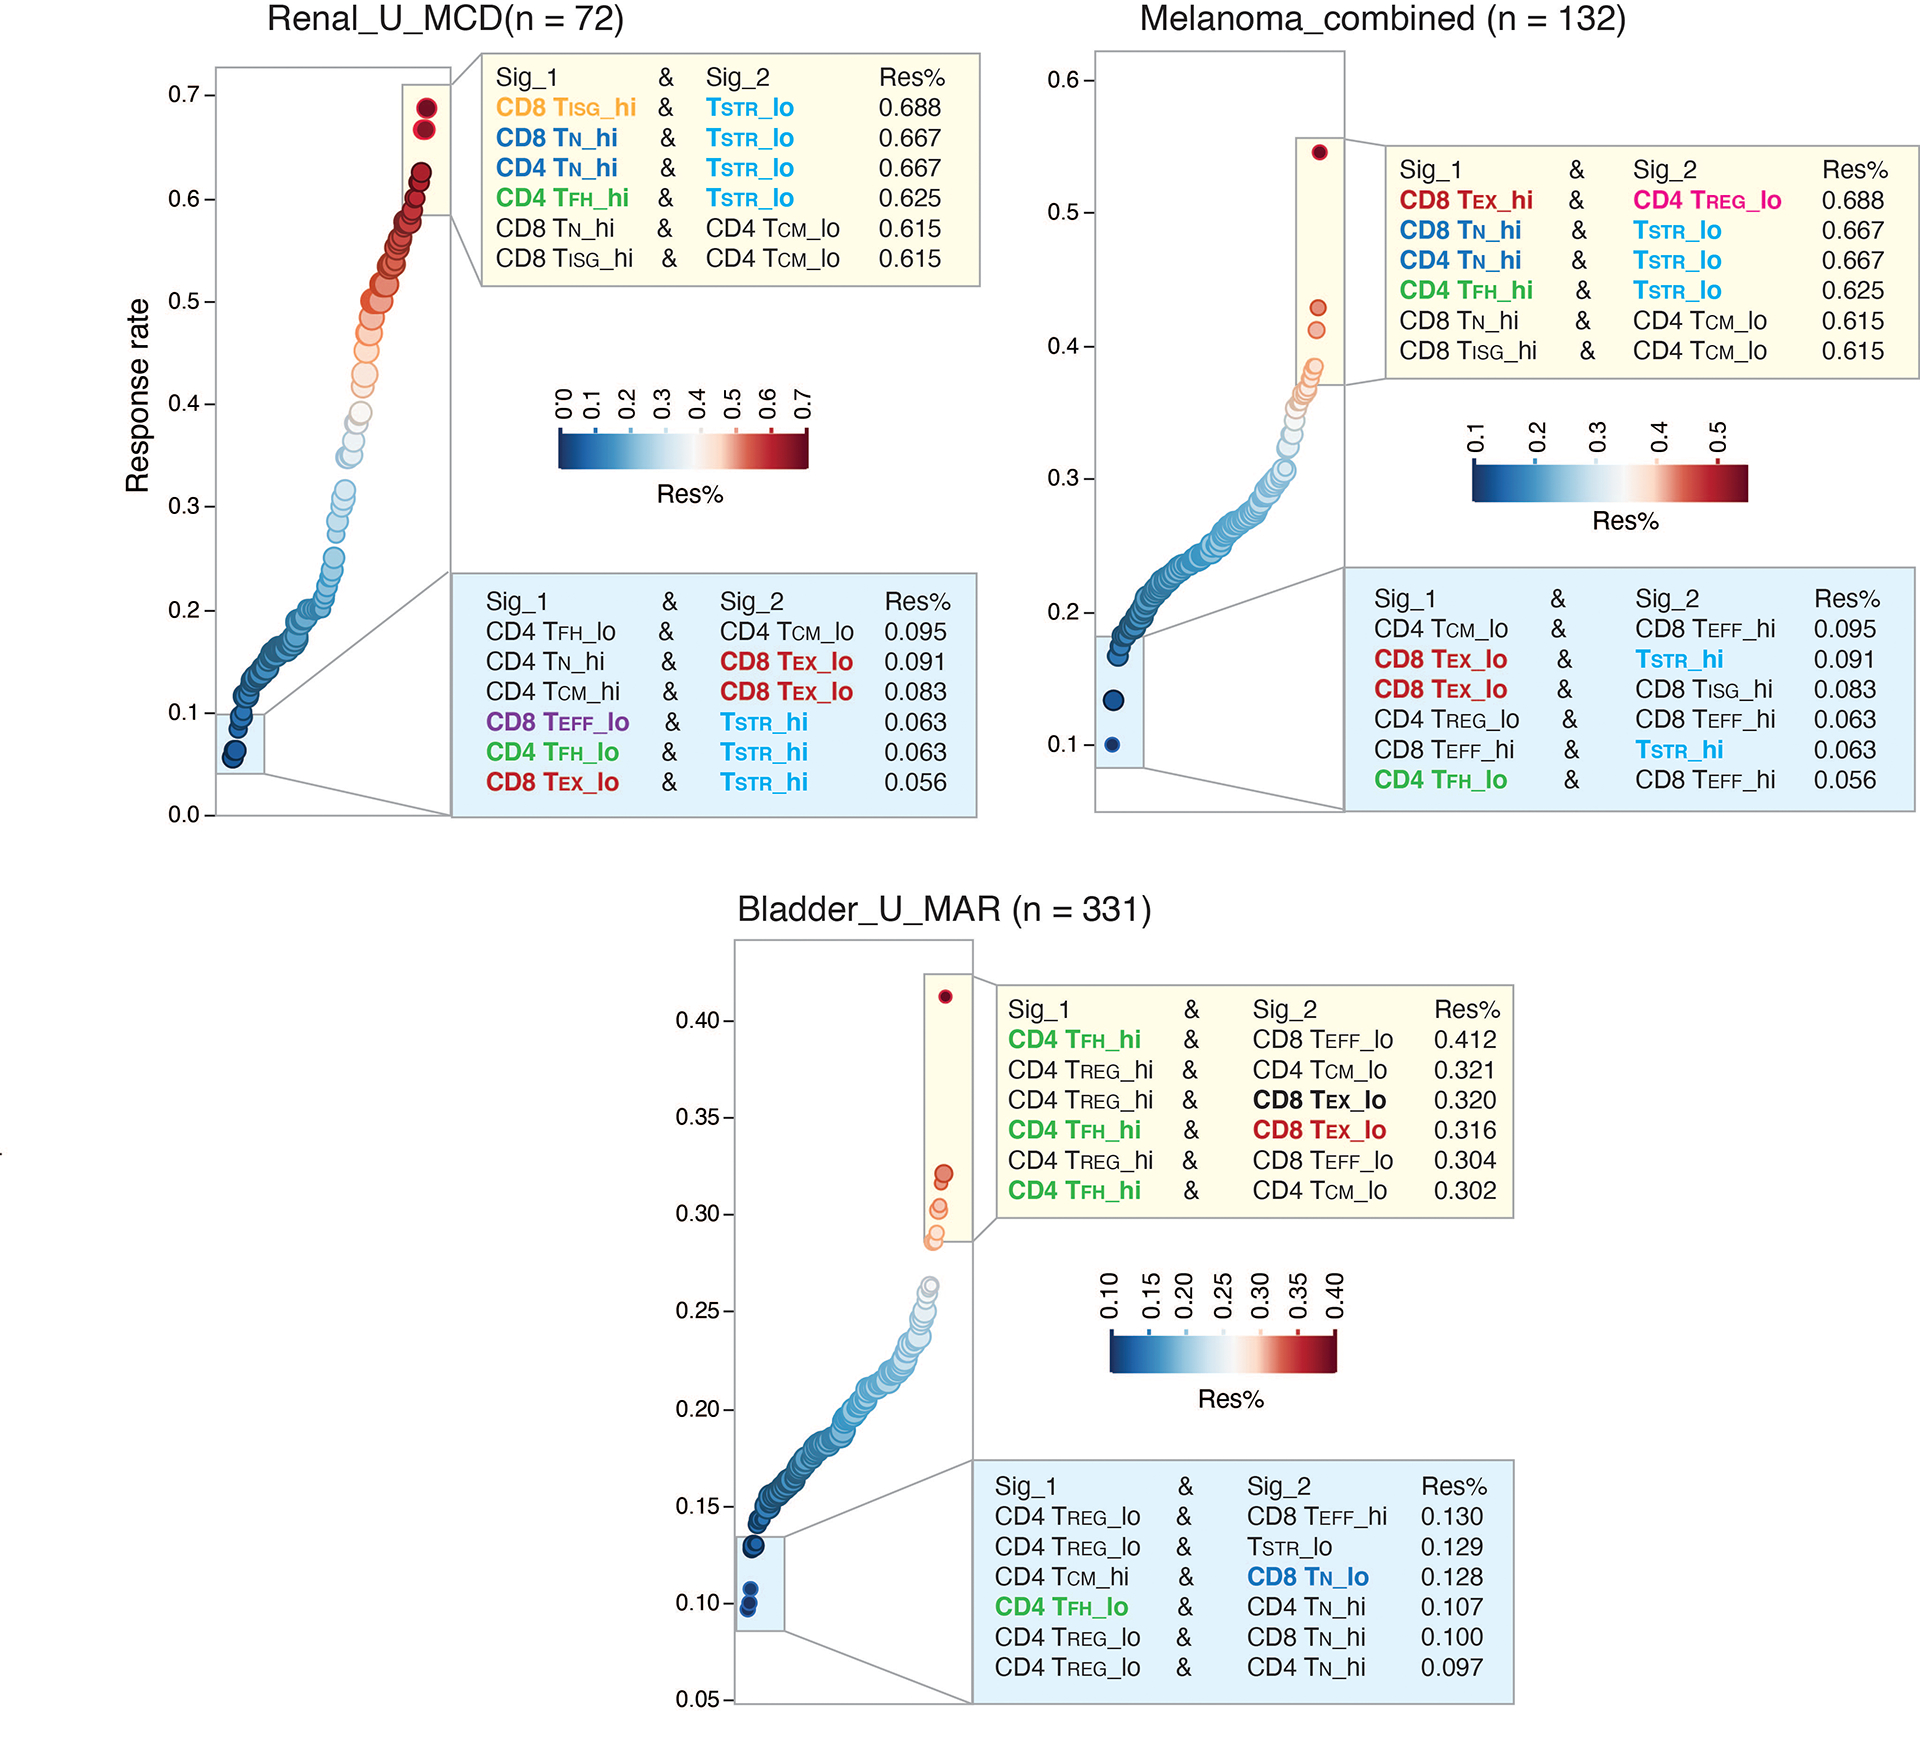
Association with ICT response in three large cohorts of cancer patients from the CPI1000+ cohort with both RNA sequencing and clinical response data available are shown. Samples predominantly represented baseline pretreatment specimens, treated with single-agent immune checkpoint inhibitor (CPI) and without prior CPI treatment. Patients of the bladder cancer cohort (Bladder_U_MAR) and renal cancer cohort (Renal_U_MCD) received single-agent anti-PD-L1 therapy and patients of the combined melanoma cohort received either single-agent anti-CTLA-4 or anti-PD-1 therapy. More details on the clinical data (for example, drug treatment and biopsy timepoint, radiological response) of these patients can be found in the Supplementary Table 1 of the original study by Litchfield et al.56. Immune deconvolution was performed on normalized gene expression data from the original study using the 9 gene signatures included in the Supplementary Table 12. For each cohort, we assessed the radiological response rates in patient groups with all the different possible combinations of T cell state gene signature expression. Patient groups showing the highest ICT radiological response rates (among top 6) or the lowest response rates (among bottom 6) are shown. Sig_1, T cell state 1; Sig_2, T cell state 2; Res%, response rate. Hi, high expression group; lo, low expression group. Hi and lo groups were split based on the group median value of gene signature expression. Recurrently presented gene signatures are highlighted in color.