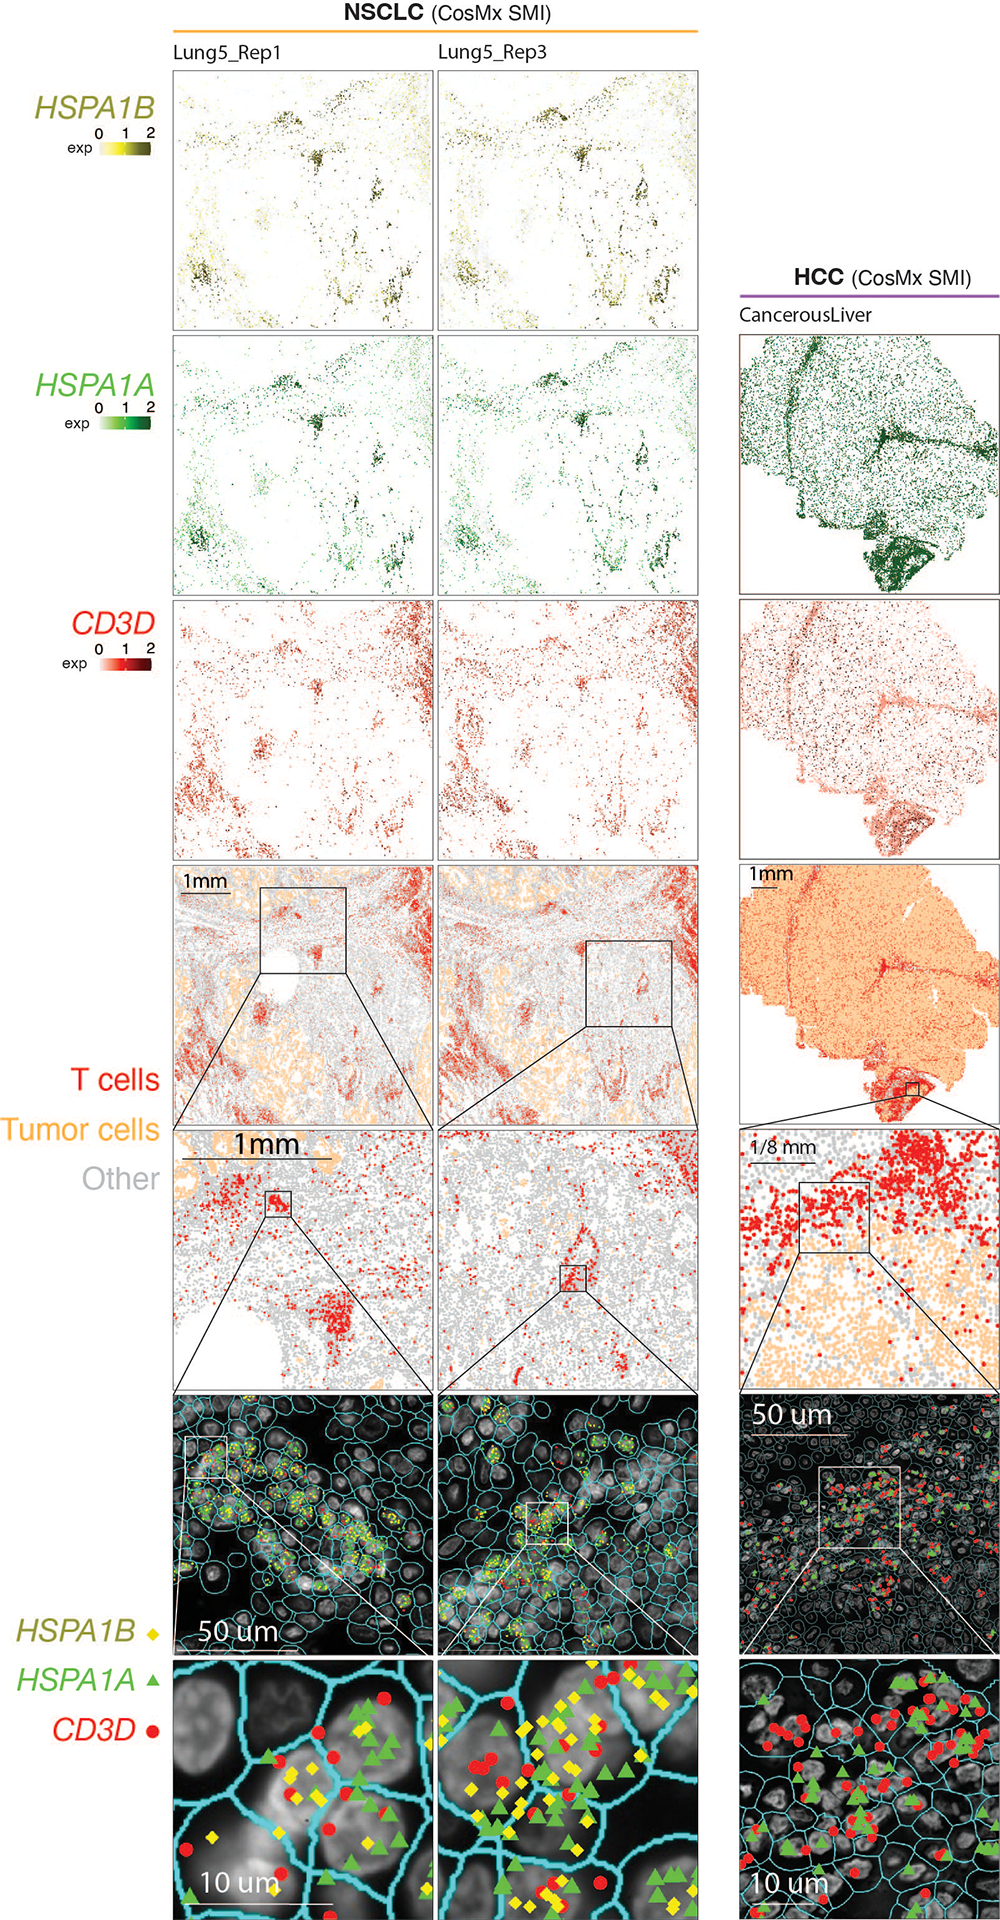
Extended Data Fig. 7. Detection of in situ HSPA1A and HSPA1B expression in tumor-infiltrating T cells in NSCLC and HCC samples by CosMx.

Two consecutive tissue sections from a NSCLC sample (sections ‘Lung 5_Rep1’ and ‘Lung 5-Rep3’) and one tissue section from a hepatocellular carcinoma (HCC) sample (section ‘CancerousLiver’) were profiled. (Column 1) Cells in physical locations (x, y coordinates). Color denotes cell type. Spatial mapping of CD3D (Column 2), HSPA1A (Column 4, Row 1/3/5), and HSPA1B (Column 3, Row 1/3) expression in T cells (note that, the HCC data does not include HSPA1B). (Column 2, Row 2/4/6) A zoom-in view of a representative area of their corresponding images in Column 1 showing lymphocyte aggregates enriched with T cells. (Column 3, Row 2/4/6) a zoom-in view of their corresponding images in Column 2 showing subcellular localization of CD3D, HSPA1B, and/or HSPA1A transcripts. (Column 4, Row 2/4/6) a further zoom-in view of their corresponding images in Column 3 showing co-localization of CD3D, HSPA1B, and/or HSPA1A transcripts in the same cells. Cell segmentation was done by the original study60. The outlines of cell nuclei were determined based on DAPI staining and the cell boundaries were determined based on morphology markers for membrane (for example, CD298) combined with a machine learning approach60.
