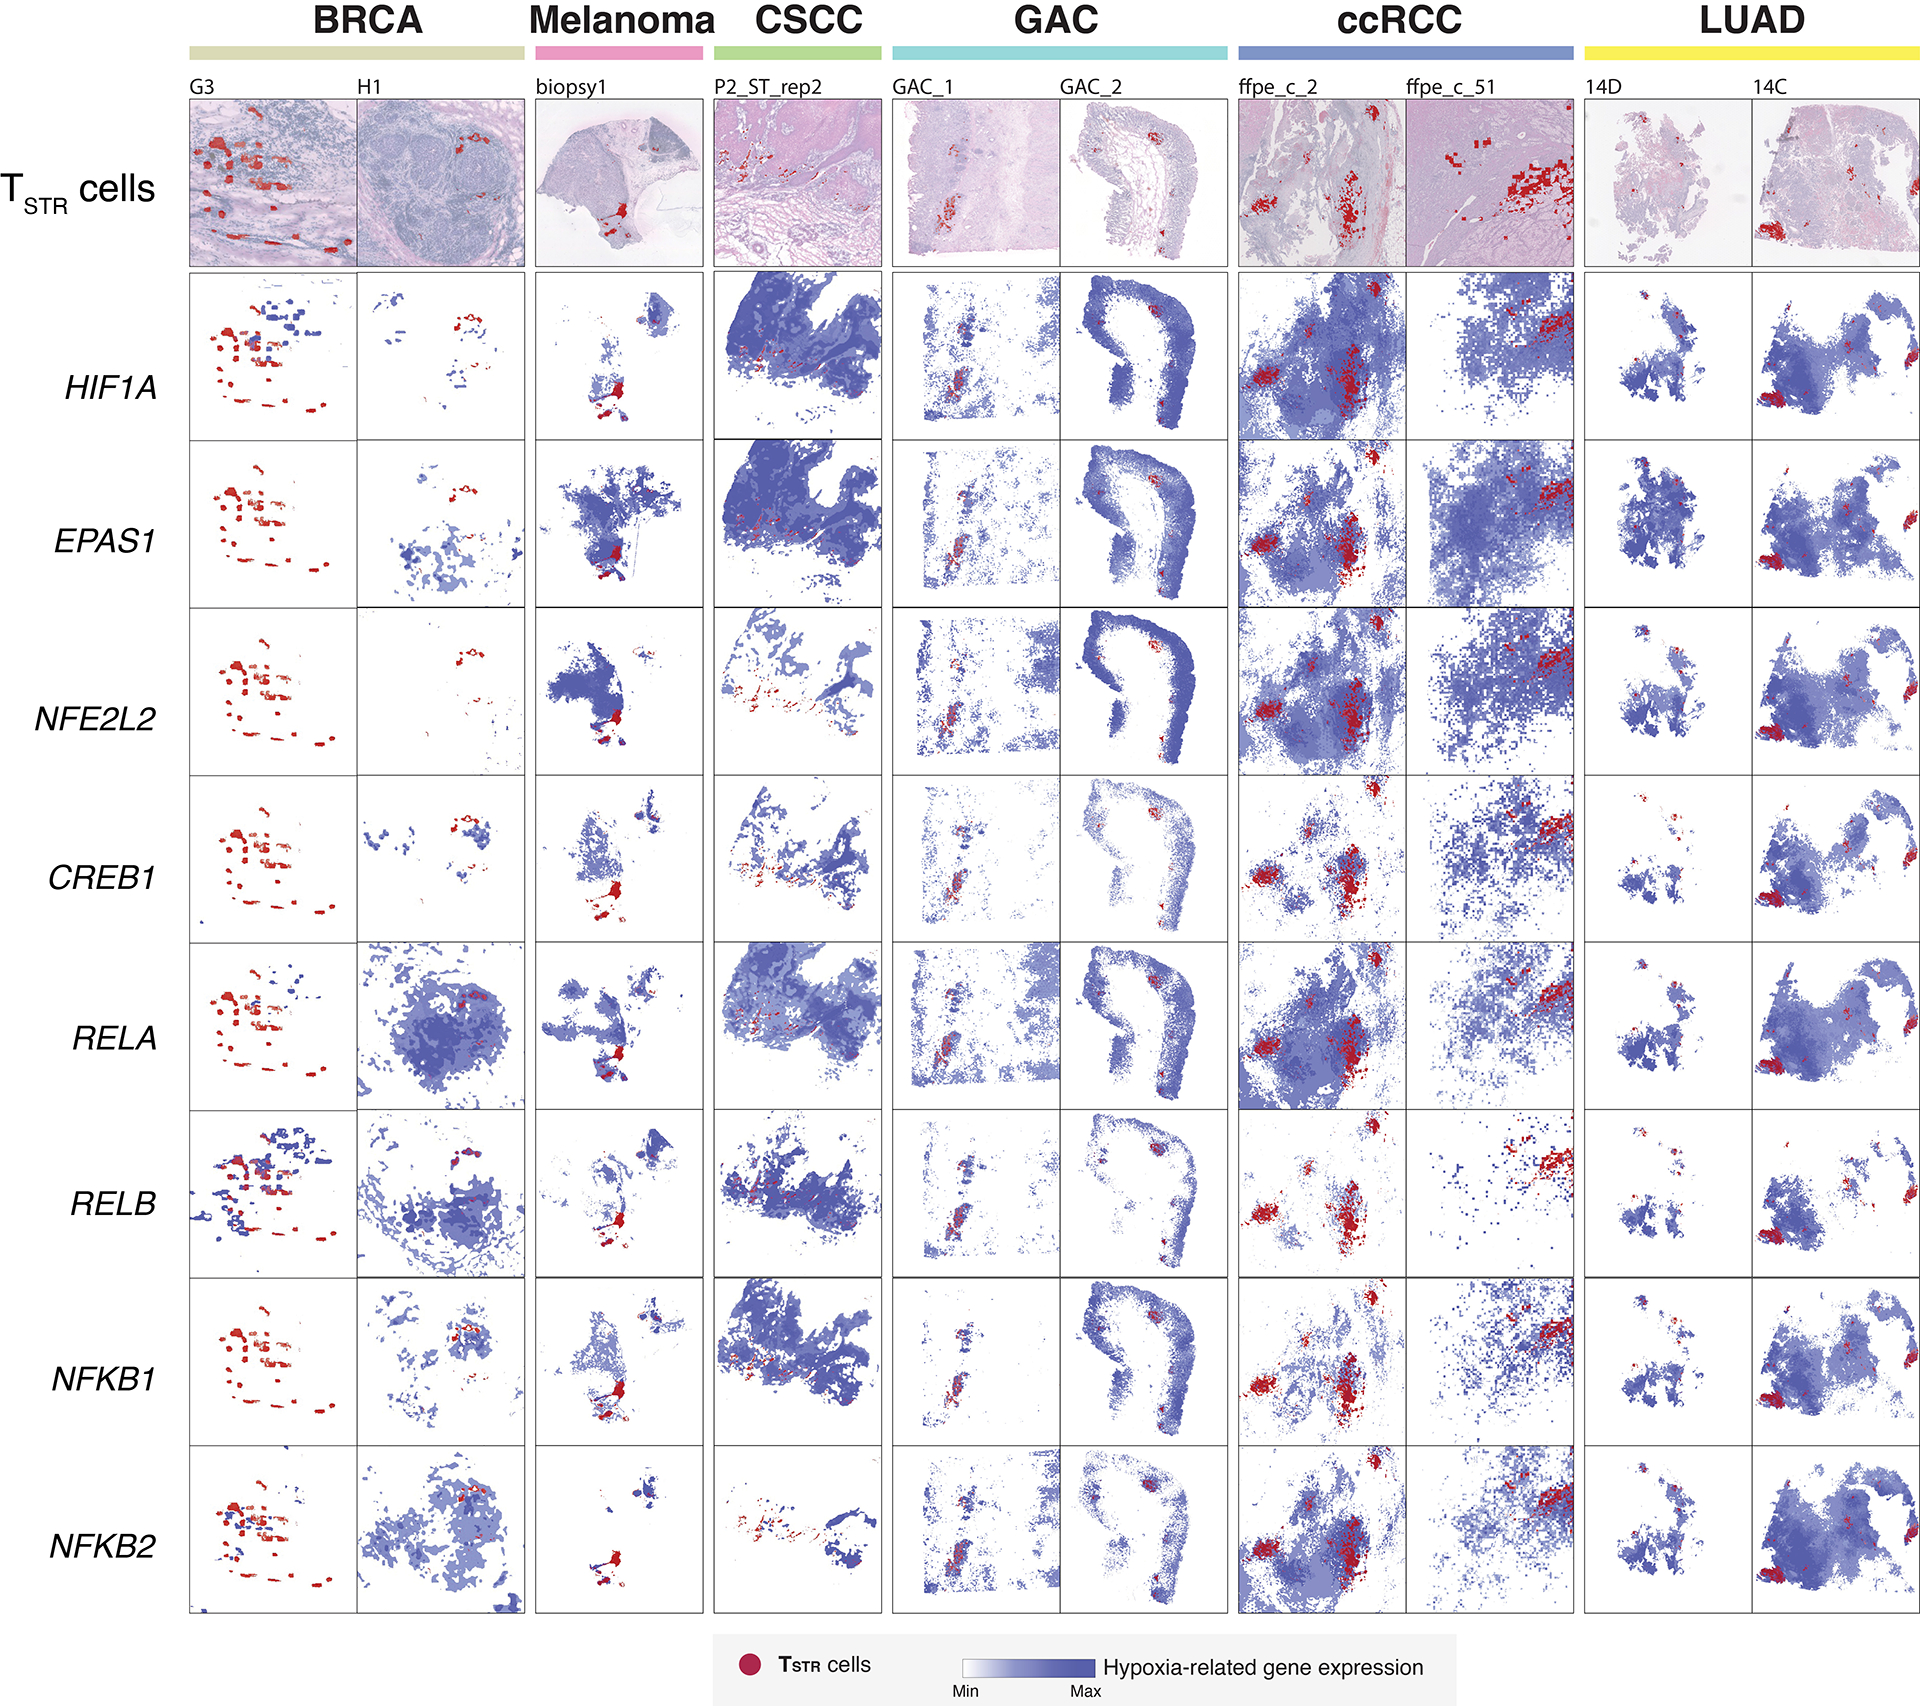
Extended Data Fig. 8. Co-mapping of TSTR cells and hypoxia-related gene expression using spatial transcriptomics.

(Top row) Mapping of TSTR cells (in red) on the histology image based on corresponding spatial transcriptomics data generated from the same tissue section. (Rest of the rows) spatial co-mapping of TSTR cells (in red) and hypoxia-related gene expression (in blue, the darker the color, the higher the level of gene expression) in the same regions as shown in the top row. BRCA, breast cancer; CSCC, cutaneous squamous cell carcinoma; GAC, gastric adenocarcinoma; ccRCC, clear cell renal cell carcinoma; LUAD, lung adenocarcinoma.
