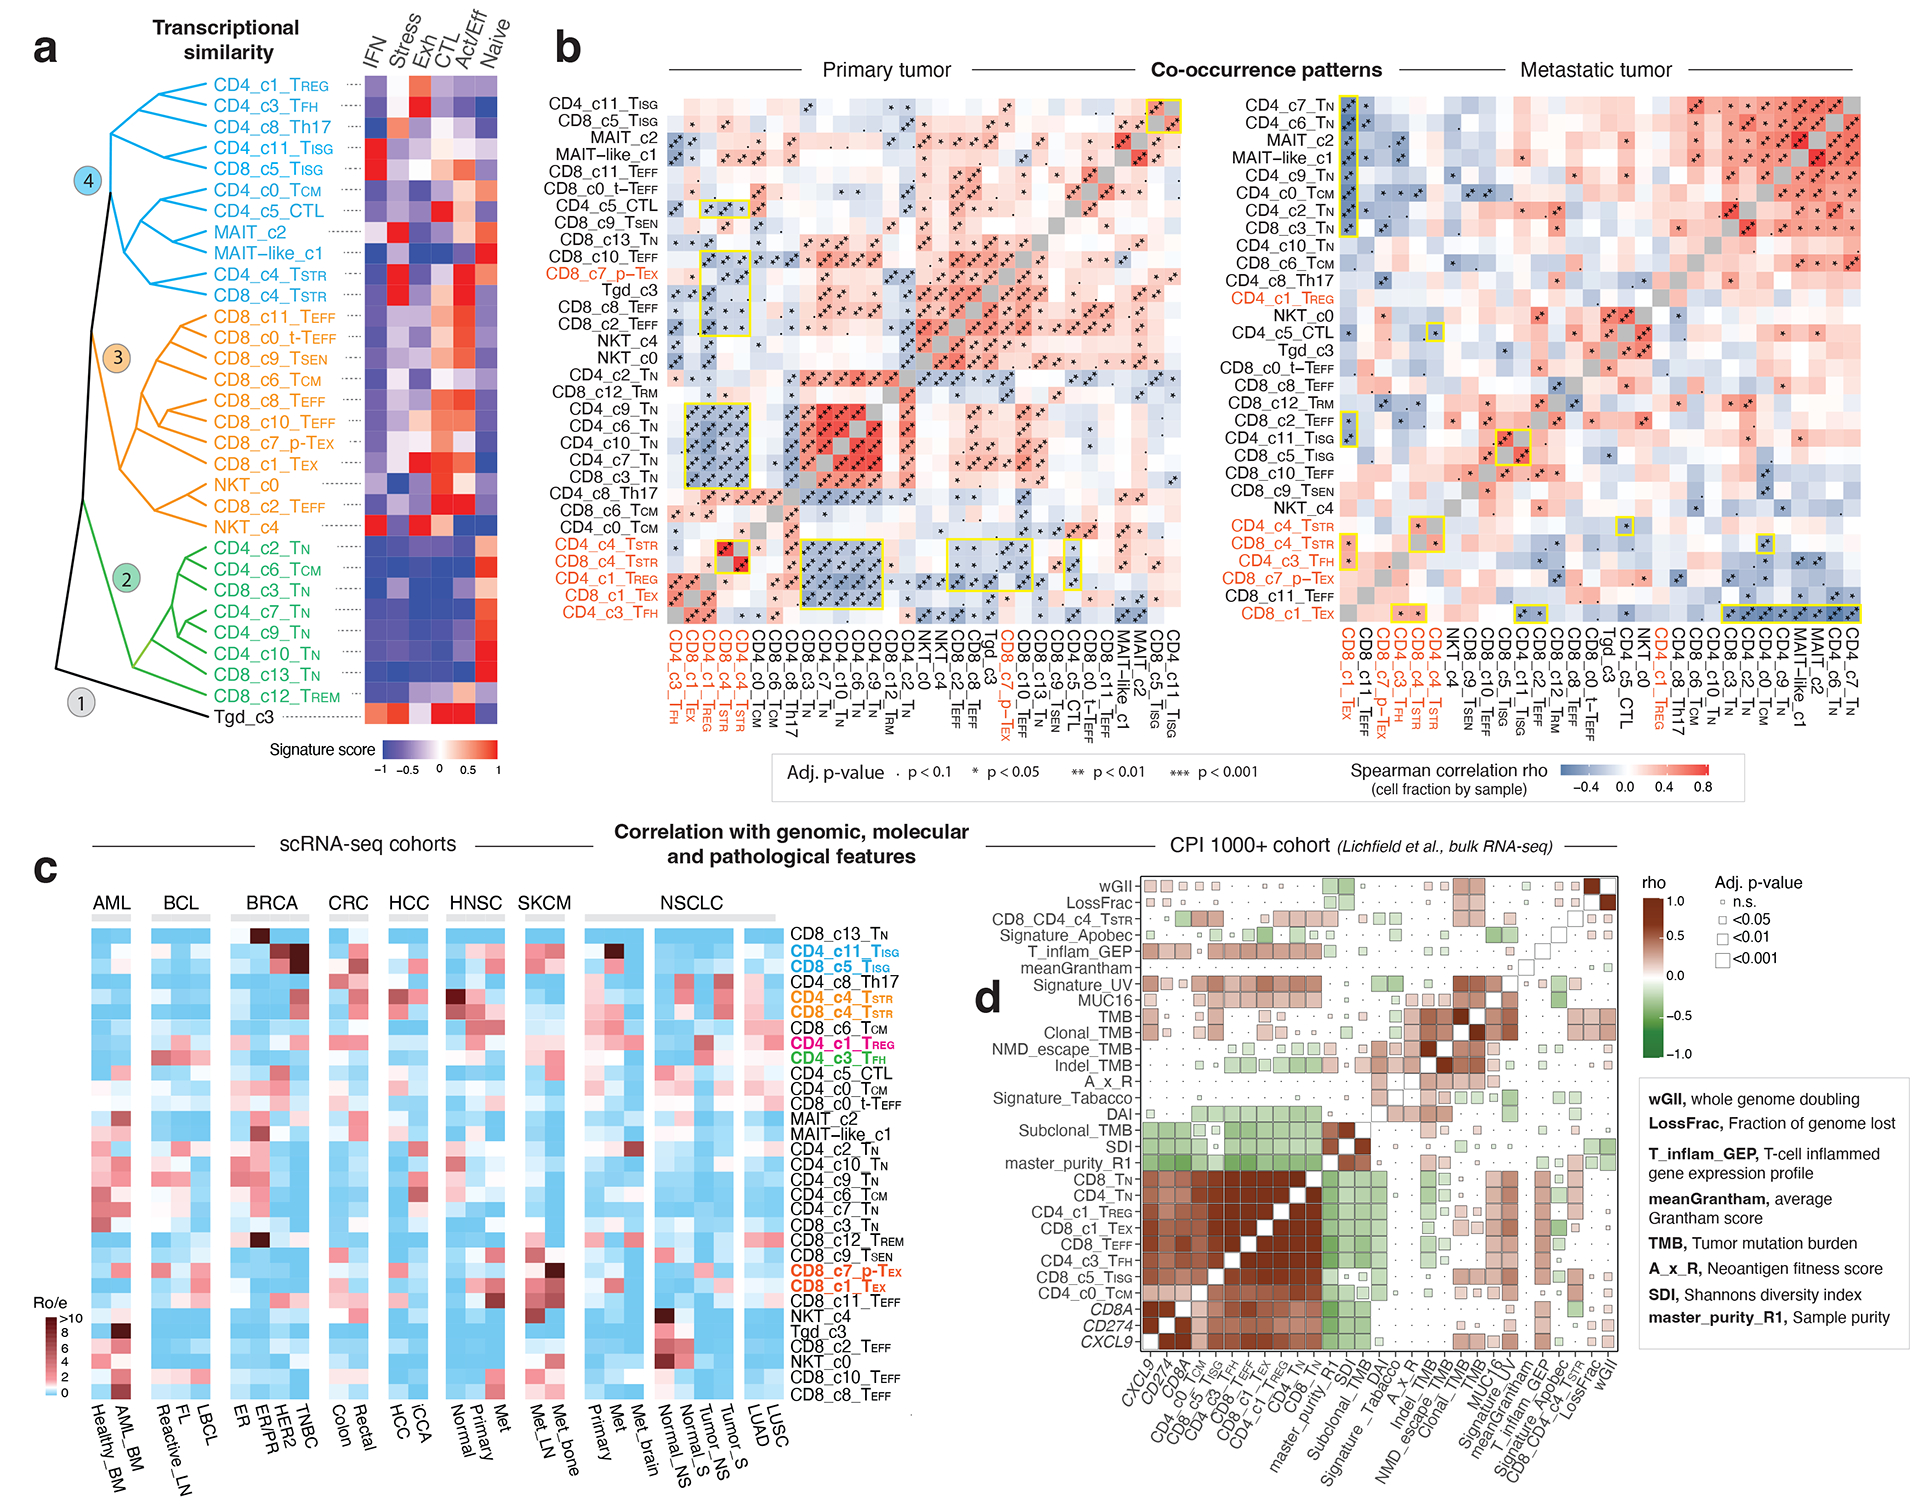
Figure 4. Transcriptional similarity and co-occurrence patterns of T cell subsets and correlations with genomic, molecular, and pathological features.

a) The dendrogram on the left displays transcriptional similarity among 31 T cell subsets. The computed Euclidean distance matrix was used for unsupervised hierarchical clustering analysis, which revealed 4 major “branches” that are colored (from bottom to top) in black, green, orange, and cyan, respectively. The heatmap on the right shows the expression of 6 curated gene signatures across T-cell clusters. The heatmap was generated based on the scaled gene signature scores. IFN, IFN response; stress, stress response; Exh, exhaustion; CTL, cytotoxicity; Act/Eff, activation/effector function. b) T cell state co-occurrence in primary tumours (left) and metastatic tumours (right). Sample-level Spearman correlation analysis was performed based on cluster frequencies of 31 non-proliferative T cell subsets. Positive co-occurrence patterns are in ‘warm’ color, and negative co-occurrence patterns are in ‘cold’ color. Color intensity is proportional to the Spearman correlation coefficient. Asterisks indicate the statistical significance based on FDR-adjusted two-sided p-values. c) Correlation with genomic, molecular, and pathological features in 16 scRNA-seq cohorts across 8 cancer types with corresponding information available, and d) the CPI1000+ cohorts. The heatmap in c) displays the distribution of T cell states across different cancer types and subtypes, as estimated by Ro/e. FL, follicular lymphoma; LBCL, large B cell lymphoma; iCCA, intrahepatic cholangiocarcinoma; NS, never smoker; S, smoker. Cancer types are labeled using the TCGA study abbreviations. The heatmap in d) illustrates correlations with TMB and additional mutation quality characteristics as well as known biomarkers of ICB therapy response (Litchfield et al.). The size of the square is proportional to statistical significance (FDR-adjusted two-sided p-value) and the color intensity is proportional to the Spearman correlation coefficient (rho). An annotation of the abbreviations is listed on the right.
