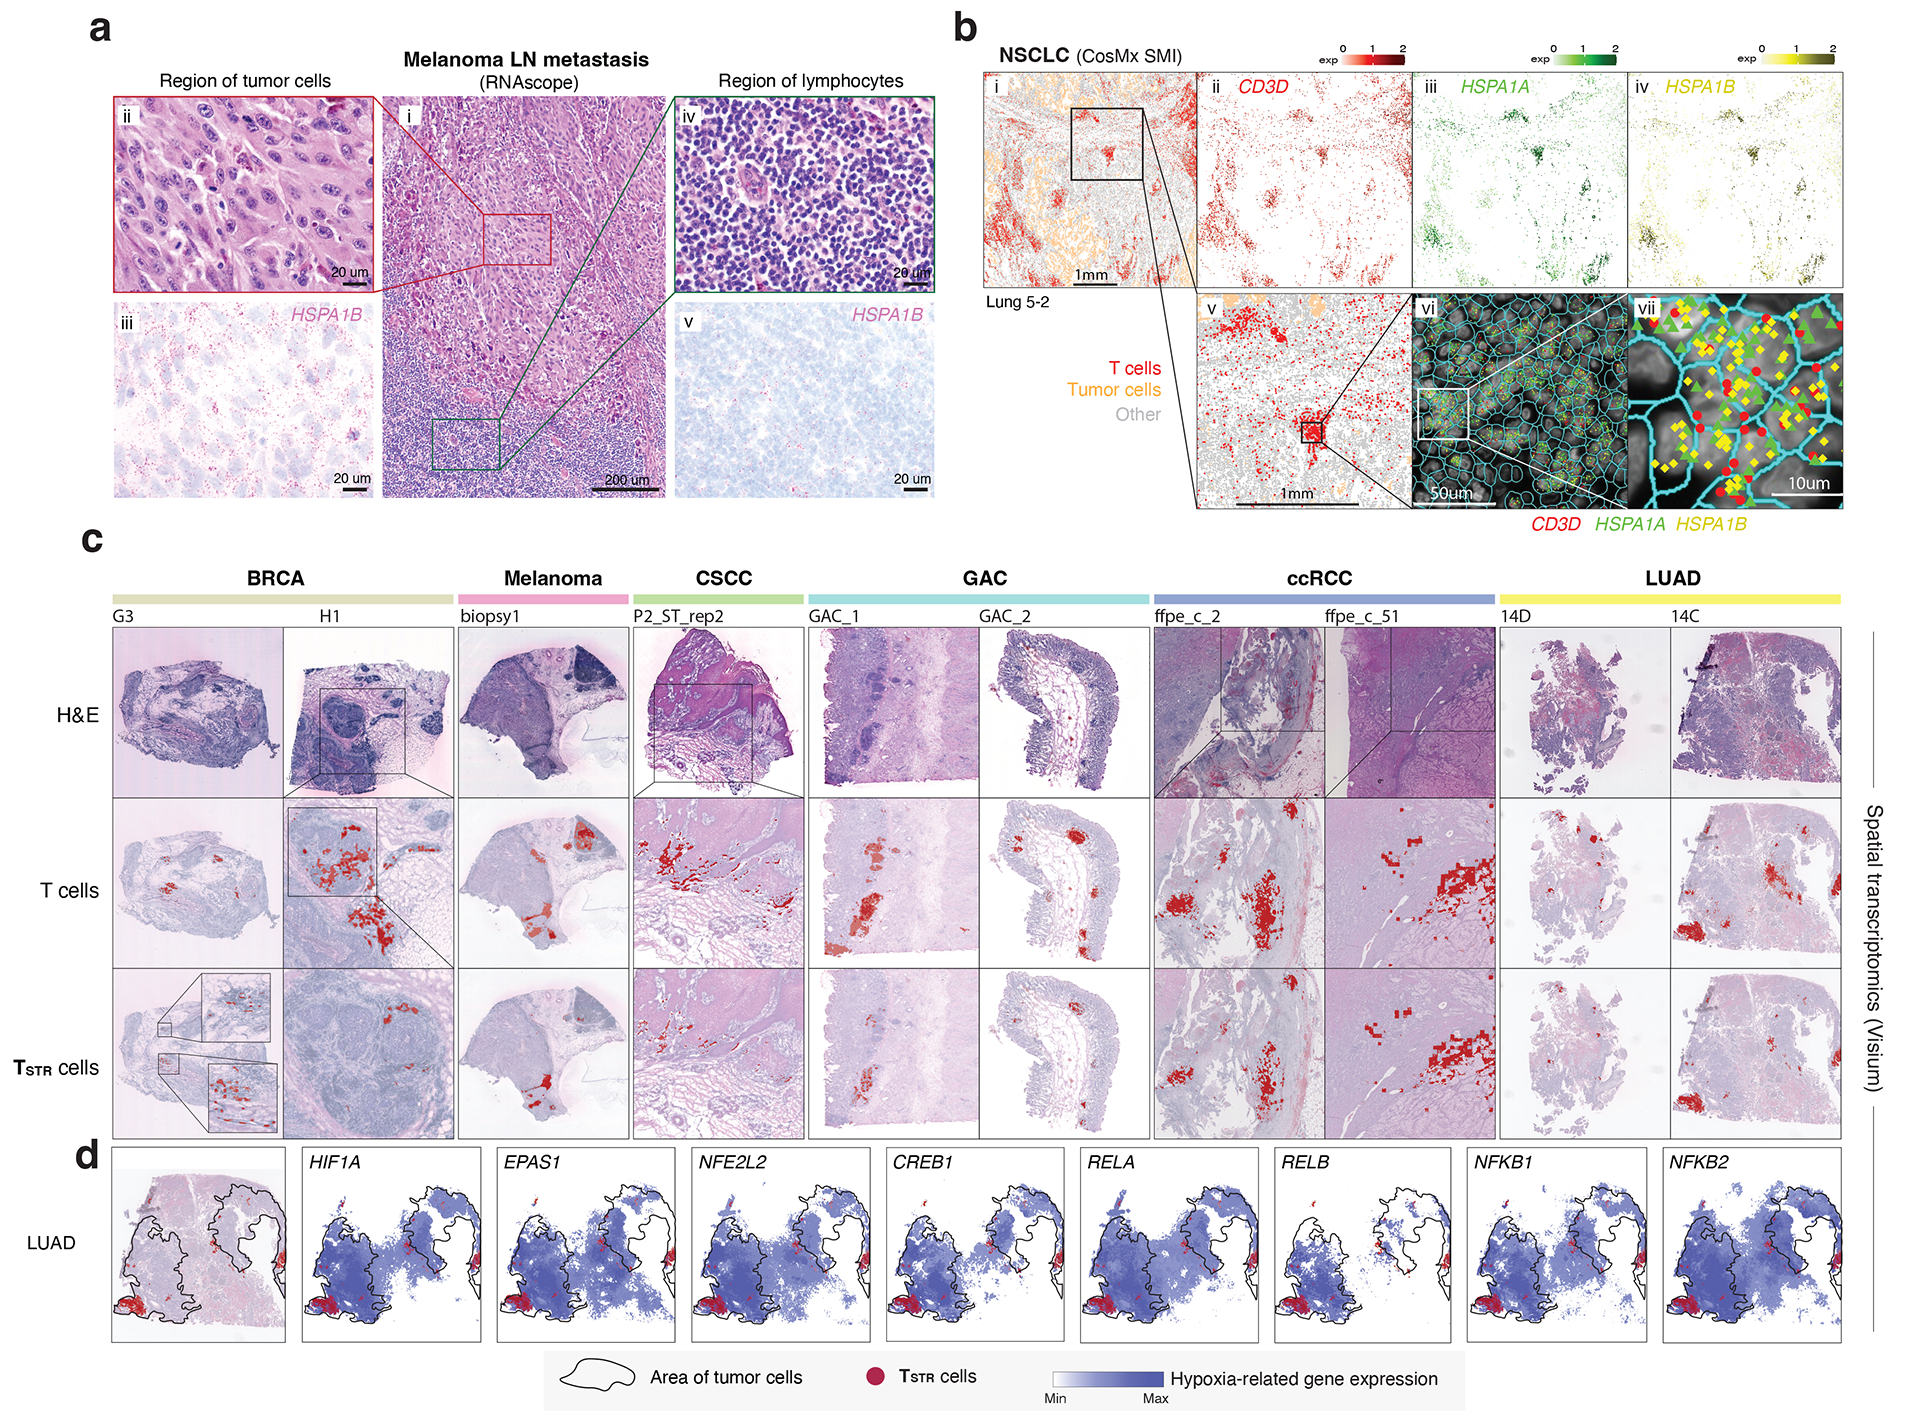
Figure 5. Detection of TSTR cells in situ using multiple different spatial profiling approaches.

a) Detection of HSPA1B expression in peritumoral lymphocytes in a melanoma lymph-node (LN) metastasis by RNAscope. (i) H&E of the sample at low magnification (40x, scale bar 200 μm), with high-magnification (400x, scale bar 20 μm) areas showing H&E and RNAscope on melanoma cells (ii & iii) and peritumoral lymphocytes (iv & v) demonstrating that both tumor cells and peritumoral lymphocytes express HSPA1B RNA. No tissue section replicate was available for this sample. b) Detection of TSTR cells in an NSCLC sample by CosMx. A representative tissue section (Lung 5–2) is shown. Two consecutive tissue sections of Lung 5–2 are presented in Extended Data Fig. 7. (i) Cells in physical locations (x, y coordinates). Color denotes cell type. Spatial mapping of CD3D (ii), HSPA1A (iii), and HSPA1B (iv) expression in T cells (the same area as i). (v) A zoom-in view of a representative area of (i) showing two lymphocyte aggregates. (vi) a zoom-in view of (v) showing subcellular localization of CD3D, HSPA1A, and HSPA1B transcripts. (vii) a zoom-in view of (vi) showing co-localization of CD3D, HSPA1A, and HSPA1B transcripts. c) Pan-cancer detection of TSTR cells by spatial transcriptomics. Representative tissue sections of 6 cancer types are shown. (top row) H&E stained tissue image. (middle row) Mapping of T cells and (bottom row) the TSTR cells on the same histology image (Melanoma, GAC, LUAD) or a high-magnification image (BRCA, CSCC, ccRCC). BRCA, breast cancer; CSCC, cutaneous squamous cell carcinoma; GAC, gastric adenocarcinoma; ccRCC, clear cell renal cell carcinoma; LUAD, lung adenocarcinoma. d) Co-mapping of TSTR cells and hypoxia-related gene expression by spatial transcriptomics in a LUAD sample (section 14C) as shown in c). (first on the left) Mapping of TSTR cells (in red) on the same image as shown in c). The black curve outlines the two tumor areas. (the remaining images on the right) Spatial co-mapping of TSTR cells (in red) and hypoxia-related gene expression (in blue, the darker the color, the higher the level of gene expression) on the same capture area.
