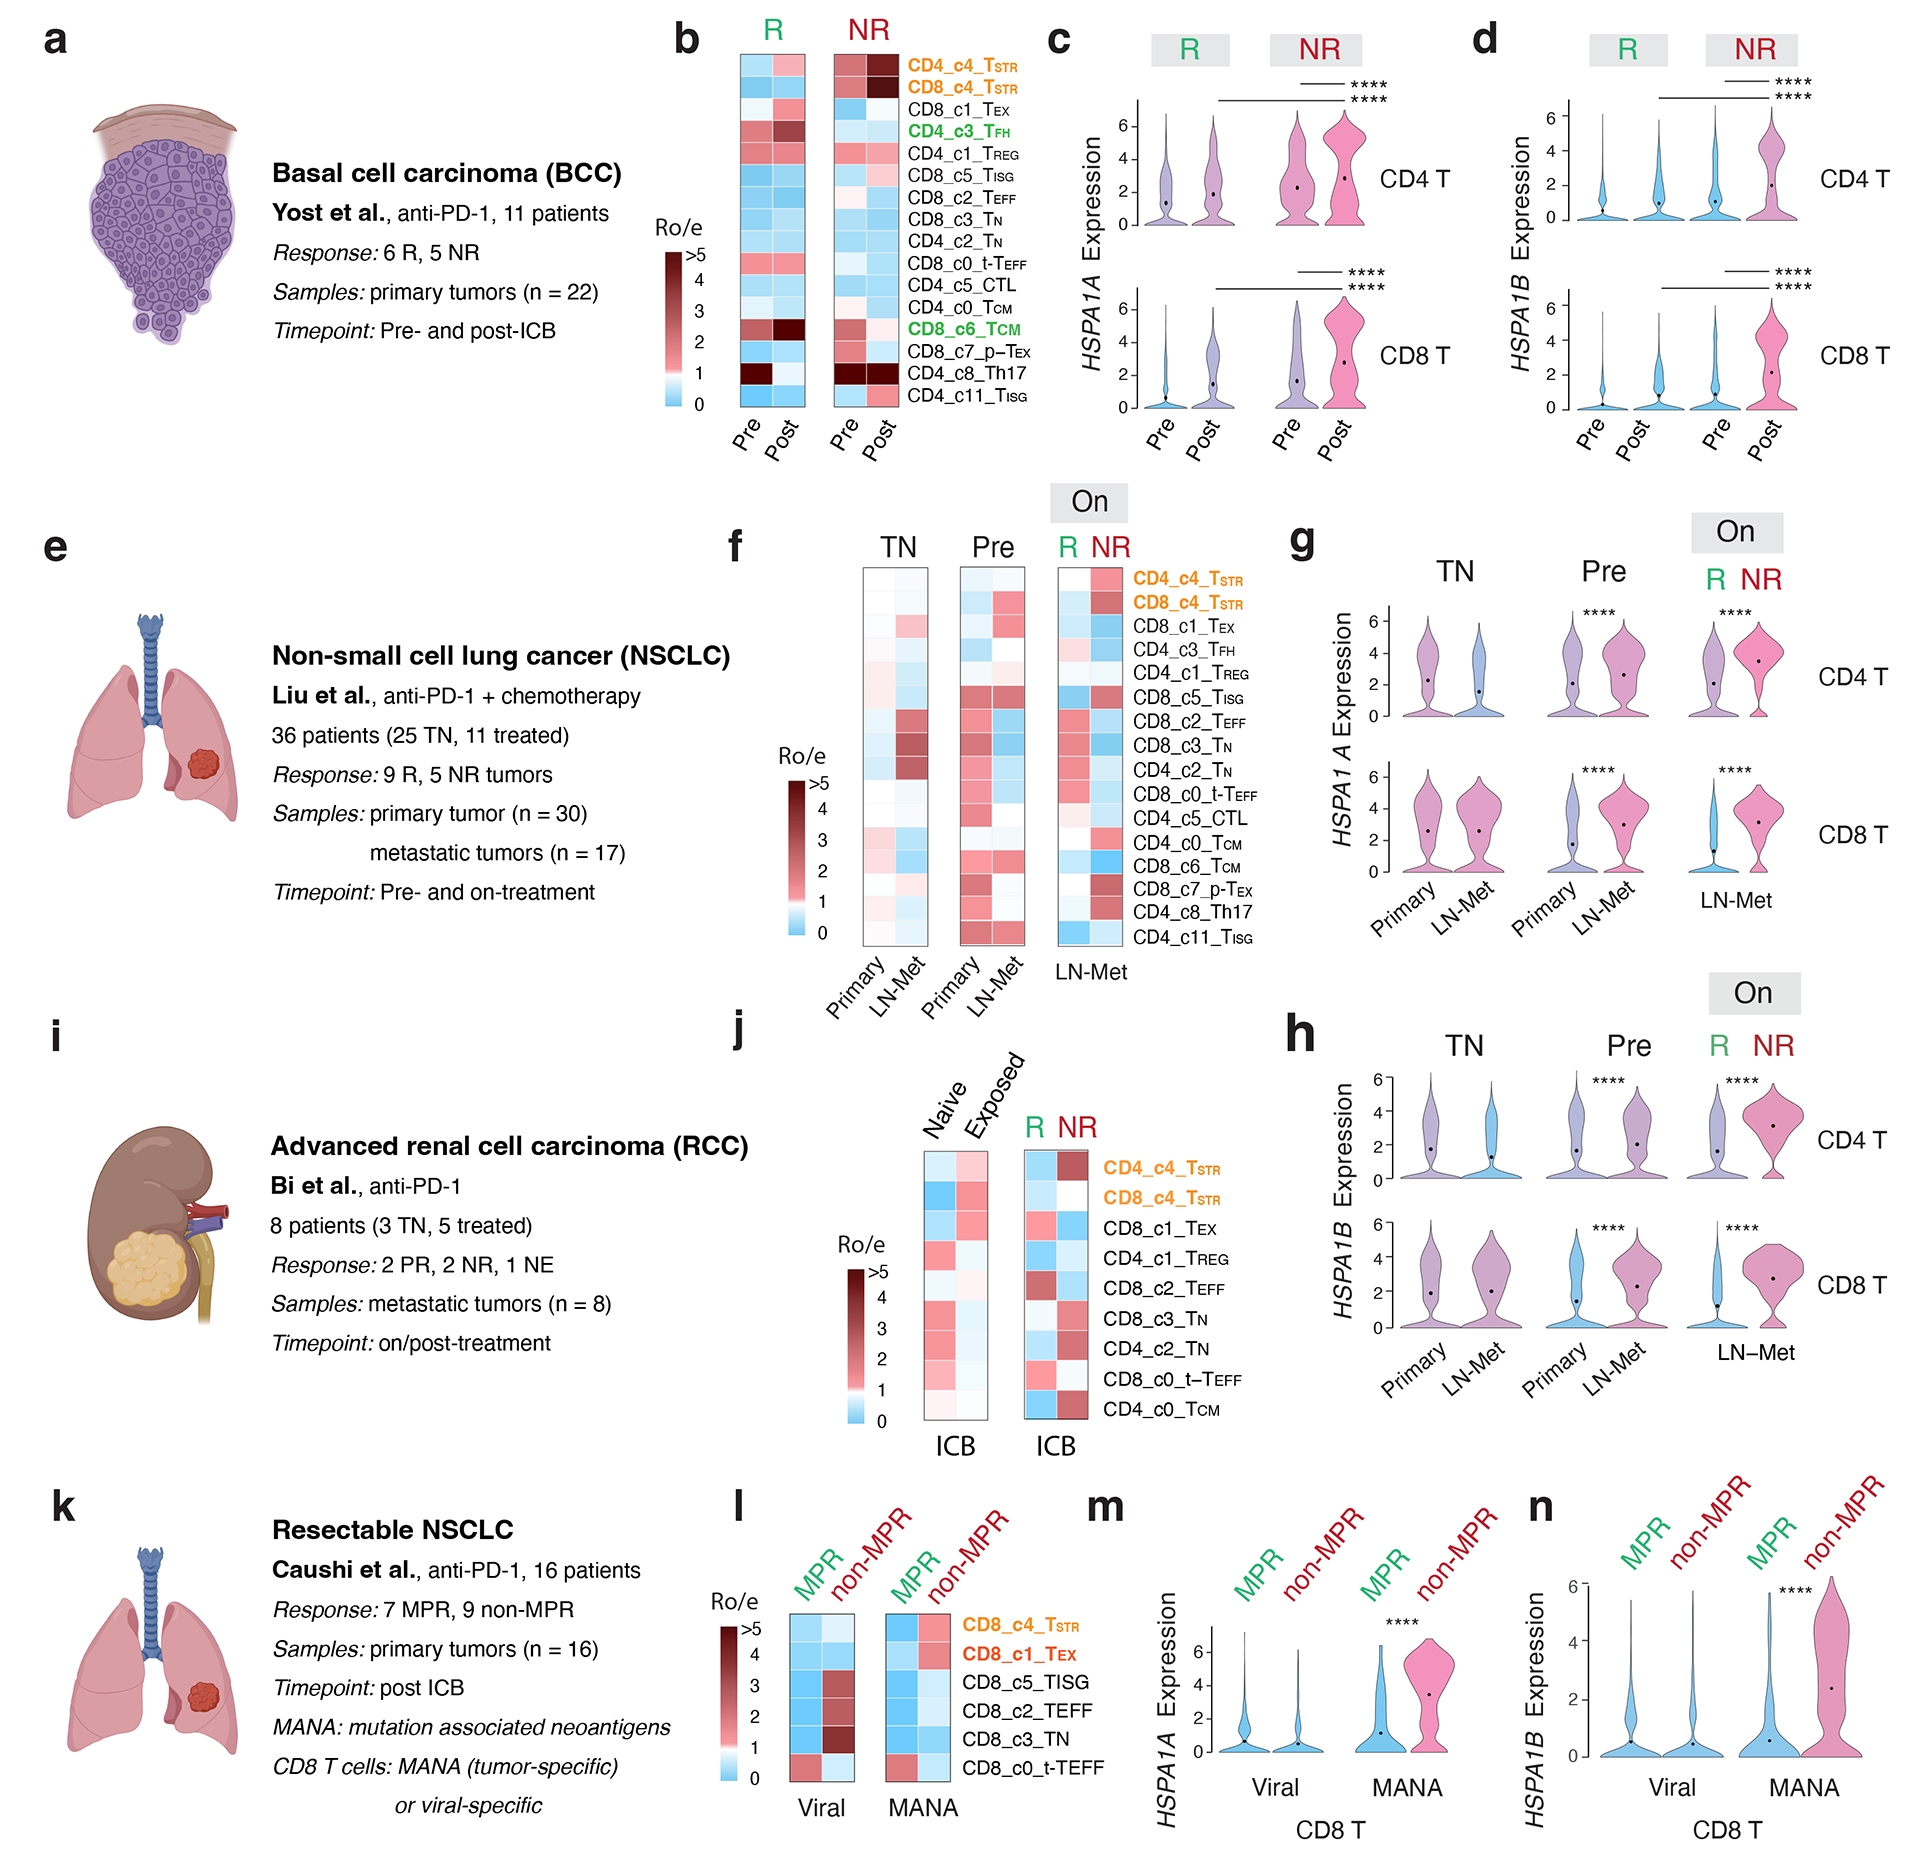
Figure 6. Significant enrichment of CD4/CD8 TSTR cells following ICB therapy across cancer types, primarily, in non-responsive tumors.

a, e, i, k) Description of the cohort, patients, and samples (created with BioRender.com). a-d) The BCC cohort. b) Enriched CD4/CD8 TSTR cells in non-responsive (NR) tumors. c) Significantly higher expression of HSPA1A (all p values < 2.2e-16) and d) HSPA1B in CD4 and CD8 T cells from NR vs. responsive (R) tumors, and at post (vs. pre)-ICB timepoint. Pre, pre-ICB; Post, post-ICB treatment (For CD4 T, pNR_Pre-vs-Post = 1.16e-11, pPost_R-vs-NR = 2.16e-8. For CD8 T, pNR_Pre-vs-Post < 2.2e-16, pPost_R-vs-NR = 1.33e-10). e-h) The NSCLC cohort. f) Enriched CD4/CD8 TSTR cells in NR tumors during ICB treatment. g) Significantly higher expression of HSPA1A and h) HSPA1B in CD4/CD8 T cells from NR vs. R tumors on ICB treatment, and in LN-met vs. primary tumors at pre-ICB timepoint. TN, treatment naïve; On, on-ICB treatment; LN-Met, lymph node metastasis (For CD4 T, pPre_Primary-vs-LN-Met < 2.2e-16, pLN-Met_R-vs-NR = 6.89e-12. For CD8 T, pPre_Primary-vs-LN-Met = 3.07e-10, pPost_R-vs-NR = 8.29e-12). i-j) The advanced RCC cohort from Bi et al. j) Enriched CD4/CD8 TSTR cells from tumors exposed to ICB treatment, and enriched CD4 TSTR cells in NR tumors post-ICB treatment. k-n) The resectable NSCLC cohort. l) Enriched CD8 TSTR cells in tumors from patients with no major pathological response (non-MPR) post-ICB treatment among MANA-specific CD8 T cells. (m) Significantly higher expression of HSPA1A (all p values < 2.2e-16) and n) HSPA1B in CD8 T cells in tumors from non-MPR patients compared to those from MPR patients post-ICB treatment, among MANA-specific CD8 T cells (all p values < 2.2e-16). MPR, defined as < 10% viable tumor at the time of surgery; MANA, mutation-associated neoantigens. MANA-specific CD8 T cells were identified using the MANA functional expansion of specific T cells (MANAFEST) assay. Viral (EBV and influenza)-specific T cells were identified using the viral functional expansion of specific T cells (ViralFEST) assay, as described in the original study. For c), d), g), h), m), and n), two-sided Welch’s t-test was applied to calculate p values: (****p≤0.0001), followed by FDR correction.
