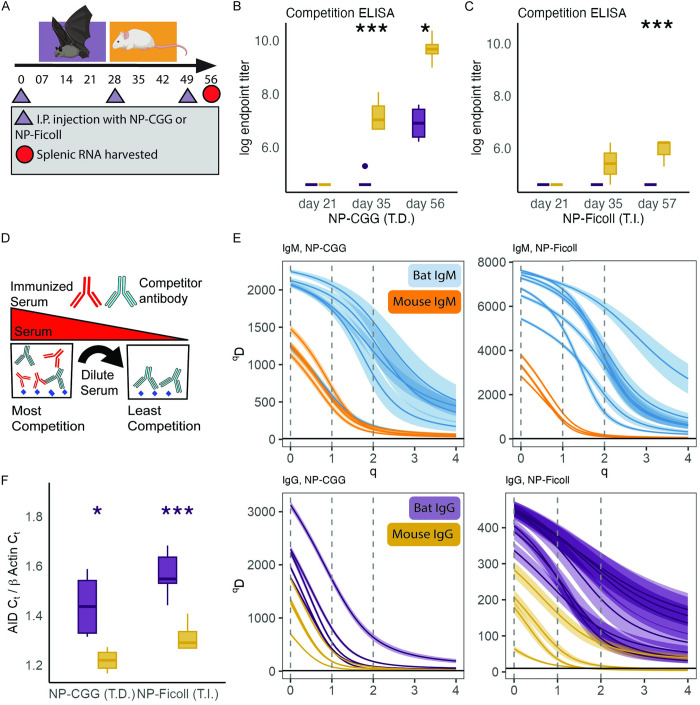
Fig 1. Experiment 1; mouse and bat side by side experiment show bats develop low affinity antibodies and have more BCR diversity in their spleens.
(A) Timeline of immunization, boosting, bleeding, and tissue collection. (B) Competition ELISA endpoint titers from bats and mice immunized and boosted with NP-CGG (T-dependent). (C) Competition ELISA endpoint titers from bats and mice immunized and boosted with NP-Ficoll (T-independent). (D) Competition ELISA visual schematic. To avoid the bias of the secondary ELISA reagents, a competitor antibody was kept at a single concentration while immunized serum was added at increasing dilutions. As the immunized animal serum is increased, its antibodies can displace the competitor antibody if it has greater affinity. A more detailed schematic is shown in S3 Fig. (E) Splenic B cell receptor IgG (top panels) and IgM (bottom panels) mRNA diversity from bats and mice against NP-CGG (left panels) and NP-Ficoll (right panels). Higher qD values indicate greater diversity within the sample. When q equals 0, the qD value reflects the total count of unique B cell receptor sequences within the data set. When q equals 1, qD reflects the Shannon diversity measurement. When q equals 2, qD reflects the Simpson Diversity measurement. Each line represents an individual animal, and a ribbon depicts the 95% CI, generated by bootstrapping. Overlapping ribbons indicate no significant differences between individuals. (F) Splenic AID mRNA CT levels normalized to beta actin for NP-CGG (right) and NP-Ficoll (left). Boxplots show the 25%, 50%, 75% percentiles, lines indicate the smallest and largest values within 1.5 times the interquartile range, dots indicate values beyond that. When an endpoint titer could not be estimated, the value was set to that of the pre-immunization serum. P values derived from F statistic. Significance codes: “***”P < 0.001, “**”P < 0.01, “*”P < 0.05. All code and data to recreate figures can be found at https://zenodo.org/records/12825679. The mouse and bat images were modified from images sourced from BioRender.com.

