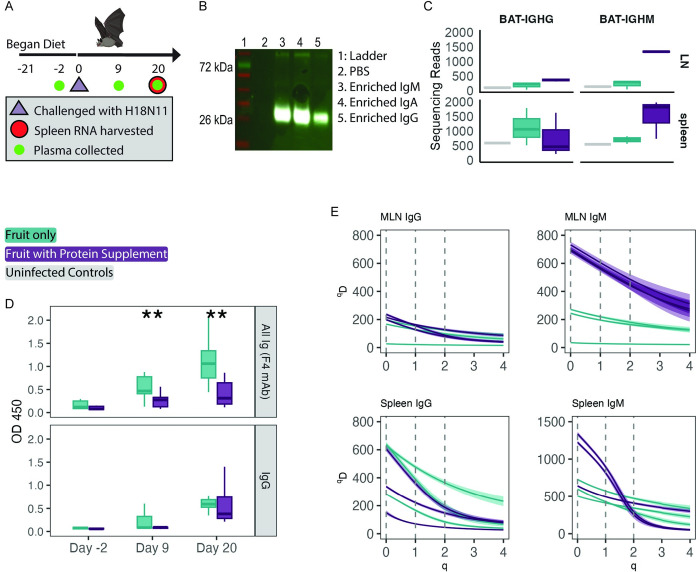
Fig 3. Experiment 3; diet manipulation impact on bat humoral immune response to H18N11 infection.
(A) Timeline of the experiment. Plasma was collected instead of serum. (B) The F4 mAb tested by western blot against bat serum enriched by size for specific subclasses. (C) Counts of the cleaned BCR sequence reads by subclass (IgG left, IgM right) and tissue (mesenteric lymph nodes “LN” top, spleen bottom). (D) Plasma antibodies after infection with H18N11 (ELISA). Plasma was tested with protein G-HRP (bottom) or the F4 monoclonal antibody (top). Statistical tests are comparing the effect of diet within a day (i.e., OD450 on day 20 for bats on protein supplement versus fruit only diet). (E) Splenic B cell receptor IgG (left panels) and IgM (right panels) mRNA diversity from MLNs (top panels) and spleen (bottom panels) of bats. Negative controls are specifically omitted because of their low sequence counts as Chao1 rarefication results in unreliable estimates when sample sizes are low. Higher qD values indicate greater diversity within the sample. When q equals 0, the qD value reflects the total count of unique B cell receptor sequences within the data set. When q equals 1, qD reflects the Shannon diversity measurement. When q equals 2, qD reflects the Simpson diversity measurement. Each line represents an individual animal, and a ribbon depicts the 95% CI, generated by bootstrapping. Overlapping ribbons indicate no significant differences between individuals. Boxplots show the 25%, 50%, 75% percentiles, lines indicate the smallest and largest values within 1.5 times the interquartile range, dots indicate values beyond that. P values refer to Student’s t test (“*”P < 0.05, “**”P < 0.005). All code and data to recreate figures can be found at https://zenodo.org/records/12825679. The mouse and bat images were modified from images sourced from BioRender.com.

