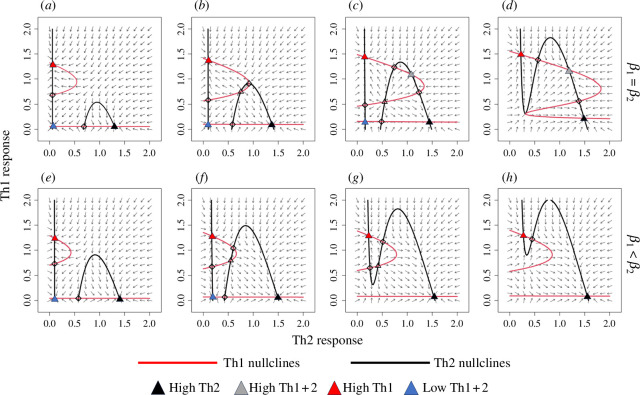
Figure 1.
Phase portraits for the dimensionless immune model (equation 2.1) as immune stimulation increases across the columns. Across the top row, ; across the bottom row, , with . Nullclines are shown by black and red lines. Nullcline intersections represent equilibria. Stable nodes are indicated by filled-in triangles, with the colour indicating the immunological state (as in figure 2); unstable nodes are indicated by hollow triangles; unstable saddles are indicated by hollow diamonds.

