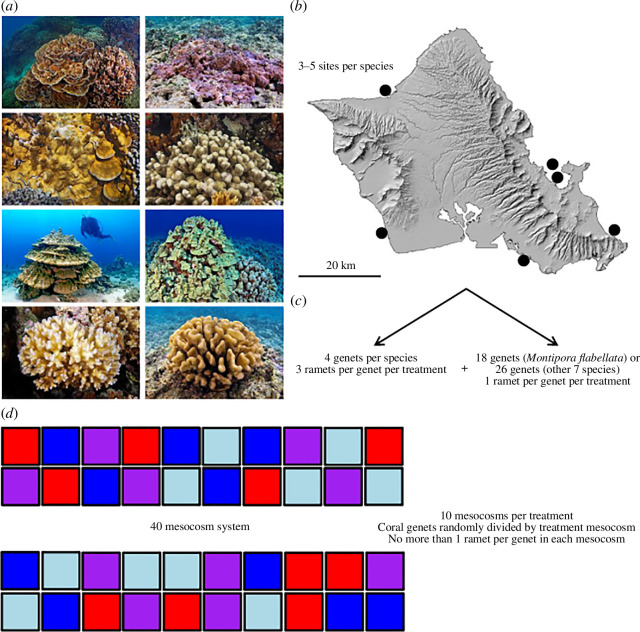
Figure 1.
Diagram illustrating the experimental design used in this study. Representative photos of each coral are shown in (a) From top-left to bottom-right these are: Montipora capitata, Montipora flabellata, Montipora patula, Porites compressa, Porites evermanni, Porites lobata, Pocillopora acuta and Pocillopora meandrina. Corals were collected from a total of six locations around O‘ahu, Hawai‘i as indicated by the black dots (b) with each species collected from three to five of the locations, depending on local abundance. The corals were then fragmented into a series of clonal nubbins (ramets) with four genotypes (genets) per species each contributing three ramets per treatment, whereas the remaining 18 genets (Montipora flabellata) or 26 genets (other seven species) each contributed one ramet per genet per treatment, yielding a total of 22 genets for Montipora flabellata and 30 genets for the remaining seven species (c) The ramets were randomly allocated among mesocosms, which were themselves randomly divided among treatments, and with no more than one ramet per coral genet in each mesocosm (d) Mesocosms are colour-coded according to treatment: control (blue), ocean acidification (light blue), ocean warming (red) and combined future ocean (purple). Photos courtesy of Keoki Stender.

