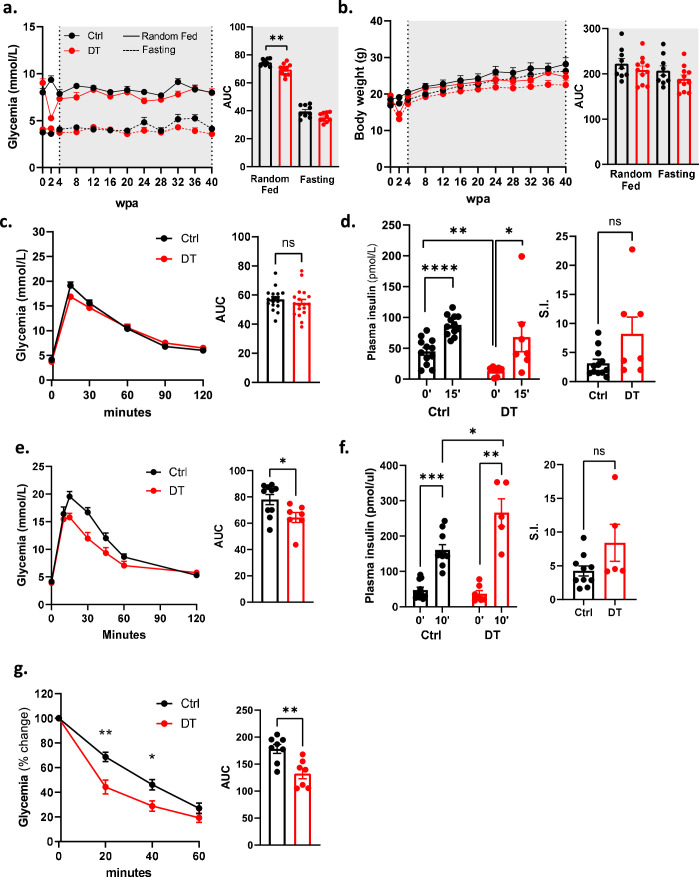
Extended Data Fig. 3. Improved blood glucose homeostasis in female β-only mice.
a. Glycemia over 40 weeks post-ablation of Ctrl (black; n = 9) and DT (red; n = 10) female mice in random-fed (RF, continuous line) or fasting (F, dashed line). Right panel: area under the curve (AUC) of glycemia. P-values (DT vs Ctrl): RF P = 0.0038; F P = 0.067. b. Body weight over 40 weeks post-ablation of Ctrl (black; n = 9) and DT (red; n = 10) female mice in RF (continuous line) or F (dashed line). Right panel: AUC of body weight. P-values DT vs Ctrl: RF P = 0.468; F P = 0.2013. c. Intraperitoneal glucose tolerance test (ipGTT) at 4wpa. Left panel: ipGTT on Ctrl (black; n = 17) and DT (red; n = 18). Right panel: AUC of ipGTT; P-value (Ctrl vs DT) P = 0.3142. d. Plasma insulin along ipGTT. Left panel: plasma insulin at 0 and 15 minutes after glucose injection in Ctrl (black; n = 12) and DT (red; n = 7) mice. Right panel: stimulation index (S.I.) of insulin secretion. P-value (Ctrl vs DT) P = 0.0646. e. Oral glucose tolerance test (oGTT) at 30 dpa. Left panel: oGTT on Ctrl (black; n = 10) and DT (red; n = 7). Right panel: AUC of oGTT. P-value (Ctrl vs DT) = 0.0431. f. Plasma insulin along oGTT. Left panel: plasma insulin at 0 and 10 minutes after glucose gavage in Ctrl (black; n = 10) and DT (red; n = 6) mice. Right panel: stimulation index (S.I.) of insulin secretion. P-value Ctrl vs DT P = 0.2424. g. Insulin tolerance test (ITT) at 30 dpa. Left panel: ITT on Ctrl (black; n = 8) and DT (red; n = 7) mice. Data are shown as % relative to glycemia at time 0. Right panel: AUC of ITT. P-value Ctrl vs DT P = 0.0093. Error bars denote s.e.m. Two-tailed Mann-Whitney test. Source data is available.

