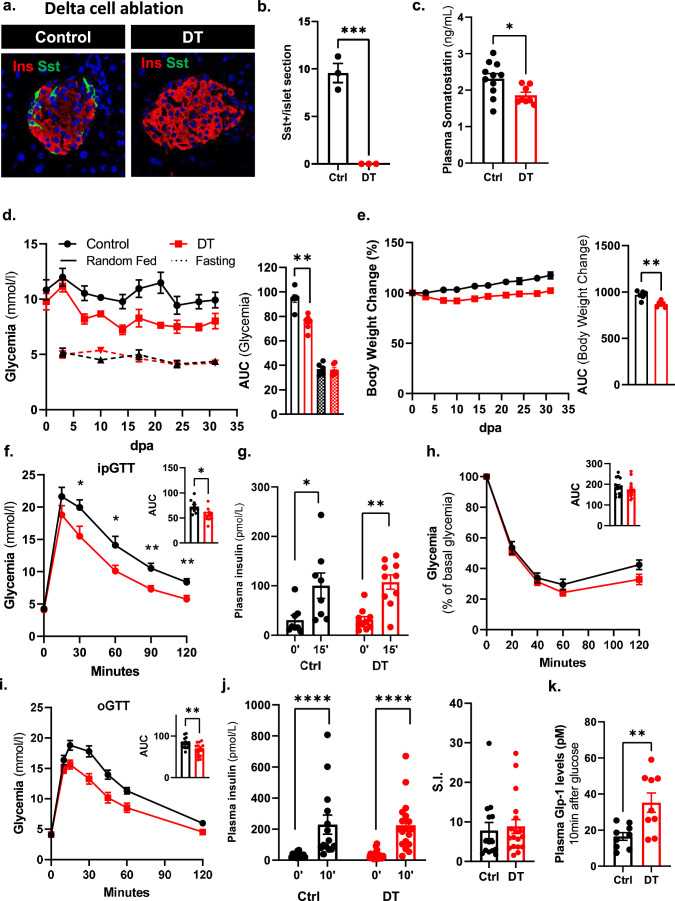
Extended Data Fig. 4. Blood glucose homeostasis in mice without somatostatin-expressing δ-cells.
a, Pancreas immunofluorescence from control (Ctrl) or δ-cell ablated mice. INS: red; SST: green. Scale bars: 20 µm. b. Quantification of SST+ cells per islet section in Ctrl (black, n = 3) or DT (red, n = 3) mice (dorsal pancreas). P-values CtrlvsDT P = 0.0007. c, Plasma somatostatin (ng/ml) in Ctrl (black, n = 11) and DT (red, n = 8). P-values CtrlvsDT: P = 0.0157. d, Glycemia of Ctrl (black, n = 6) and DT (red, n = 6) in RF (continuous line) or F (dashed line). Right panel: area under the curve (AUC). P-values: RF DTvsCtrl P = 0.0043; F DTvsCtrl P = 0.8182. e, Body weight change (% from day 0) of Ctrl (black, n = 6) and DT (red, n = 6) in random-fed. Right panel: AUC. P-values: RF DTvsCtrl P = 0.0043. f, Intraperitoneal glucose tolerance test (ipGTT) on Ctrl (black, n = 9) and DT (red, n = 10). Right panel: AUC; P-value CtrlvsDT P = 0.0279. g, Plasma insulin at 0 and 15 minutes after glucose in Ctrl (black, n = 8) and DT (red, n = 10). P-value Ctrl (0’ vs 15’) = 0.0140; DT (0’ vs 15’) = 0.0015. h, Insulin tolerance test (ITT) on Ctrl (black, n = 9) and DT (red, n = 10). Data are shown as % relative to glycemia at time 0. Right panel: AUC; P-value CtrlvsDT=0.0789. i, Oral glucose tolerance test (oGTT) on Ctrl (black, n = 8) and DT (red, n = 10). Right panel: AUC; P-value (CtrlvsDT) = 0.0055. j, Plasma insulin at 0 and 10 minutes after glucose in Ctrl (black, n = 7) and DT (red, n = 10). P-value Ctrl (0’ vs 10’) = 0.0041; DT (0’ vs 10’) = 0.0011. Right panel: stimulation index (S.I.) of insulin; P-value (CtrlvsDT)=0.9623. k, Plasma GLP-1 along oGTT in Ctrl (black, n = 9) and DT (red, n = 9). P-value (CtrlvsDT)=0.0056. Only male mice were used. Data are shown as mean ± sem. Statistical tests are two-tailed Mann-Whitney. Source data is available.

