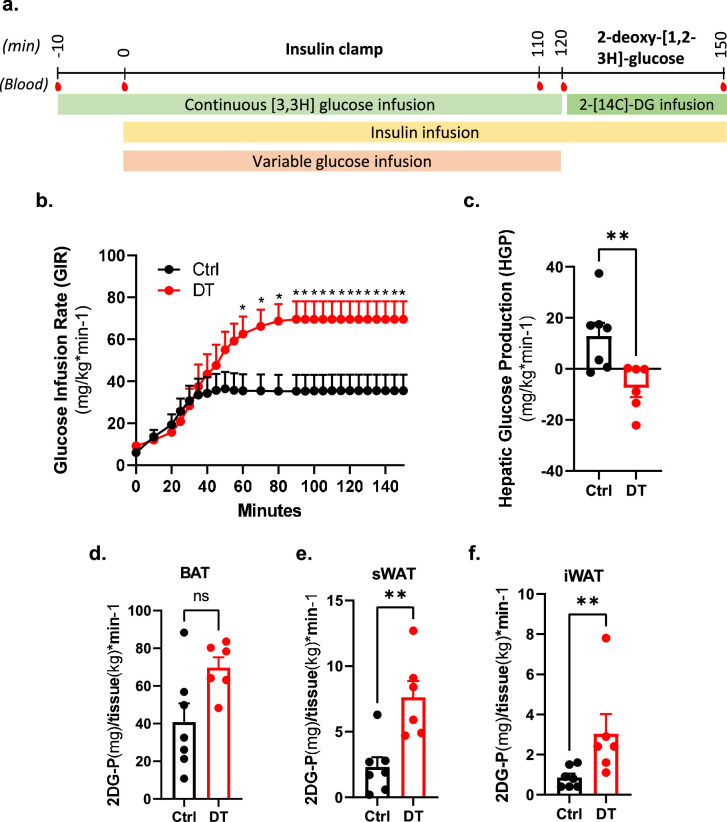
Extended Data Fig. 5. Hyperinsulinemic-euglycemic clamp after non β-cell ablation.
a, Experimental time-line for the hyperinsulinemic-euglycemic clamp. 2.5mUI/kg/min of insulin were continuously infused during the insulin clamp. Blood samples were taken at multiple time for further analyses. b-c, Glucose infusion rate (GIR, b) and hepatic glucose production (HGP, c) measured during clamp studies in Ctrl (black, n = 7) and DT (red, n = 6) mice. P-values: CtrlvsDT HGP P = 0.007. d-f, Radiolabeled 2-deoxy-D-glucose (2DG) uptake by adipose tissue in Ctrl (black, n = 7) and DT (red, n = 6) mice. P-values (Ctrl vs DT): Brown Adipose Tissue (BAT) P = 0.073; subcutaneous White Adipose Tissue (sWAT) P = 0.008; inguinal White Adipose Tissue (iWAT) P = 0.005. Insulin clamp and 2DG uptake were obtained from the same mice. Only male mice were used. All data are shown as mean ± sem. All statistical tests are two-tailed Mann-Whitney test. Source data is available.

