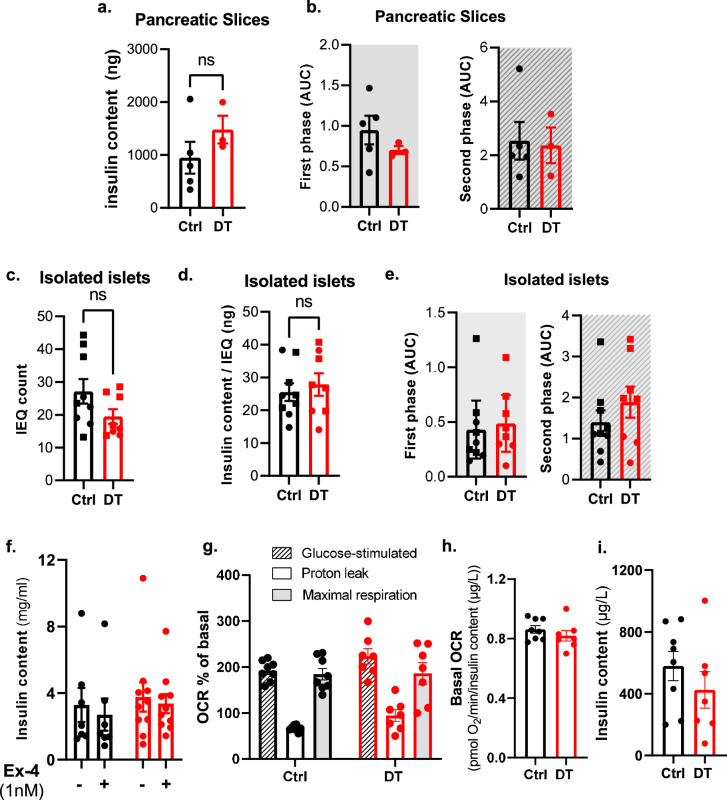
Extended Data Fig. 8. Ex vivo dynamic insulin secretion in pancreatic slices and isolated islets.
a, Pancreatic insulin content (ng) of slices from control (Ctrl, black, n = 5) and DT (red, n = 3). P-value CtrlvsDT=0.250. b, Area under the curve (AUC) of the first phase (grey area, 14- and 24-minutes) and second phase (dashed grey area, 30- and 58-minutes). P-values (CtrlvsDT): first phase P = 0.393; second phase P = > 0.999. c-d, Islet equivalent count (IEQ, c) and ratio insulin content (ng) and IEQ count (d) of Ctrl (black, n = 9) and DT (red, n = 8). P-value: IEQ count (CtrlvsDT) P = 0.2359; ratio insulin content and IEQ (CtrlvsDT) P = 0.743. e, AUC of first phase (P-value CtrlvsDT P = 0.393) and second phase (P-value CtrlvsDT P = > 0.999) of insulin secretion in isolated islets of Ctrl (black; n = 9) and DT (red; n = 8) mice. f, Total insulin content (ng) of isolated islets from Ctrl (black, n = 7) and DT (red, n = 10) mice with or without Exendin-4 (Ex-4). P-value without Ex-4 CtrlvsDT P = 0.601; P-value with Ex-4 CtrlvsDT P = 0.3031. g-h. Islet respirometry parameters. g. Glucose-stimulated OCR (dashed lined column), proton leak and maximal respiration (grey column) in islets from Ctrl (black, n = 8) and DT (red, n = 7) mice. P-values (CtrlvsDT): Glucose-stimulated OCR P = 0.3285; Proton leak P = 0.2046; Maximal respiration P = 0.999. h. Basal respiration measured at 3 mM glucose from Ctrl (black, n = 8) and DT (red, n = 7). 2-4 wells/mice, 8-10 islets/well. P-values Ctrl vs DT P = 0.281. i. Total insulin content of islets from Ctrl (black, n = 8) and DT (red, n = 7) after OCR measurements. P-values CtrlvsDT P = 0.3357. Each data point (g-i) represents the average values per mouse. Only male mice were used. All data are shown as mean ± sem. All statistical tests are two-tailed Mann-Whitney test. Source data is available.

