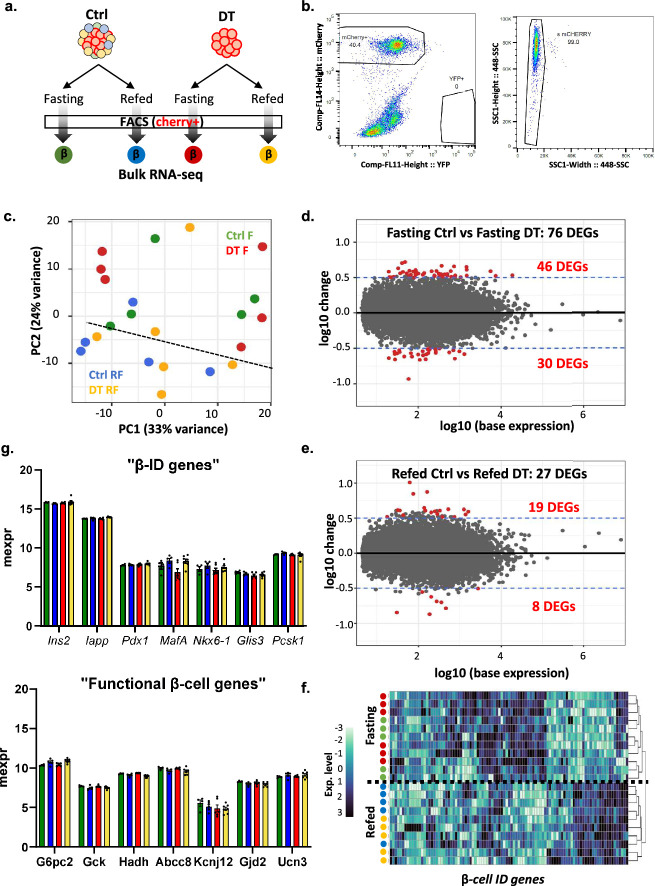
Extended Data Fig. 9. Transcriptomic analysis of β-cells isolated from control and β-only mice.
a, Experimental design. b, Representative gating strategy used for FACS sorting the mCherry+ insulin-expressing cells in Ctrl and β-only mice for RNA-seq analysis. c, Principal component analysis (PCA) of RNA-seq samples. Each dot represents one sample. Four different conditions: Control Fasting (Ctrl F, green, n = 5), DT Fasting (DT F, red, n = 6), Control Refed (Ctrl RF, blue, n = 5) and DT Refed (DT RF, yellow, n = 6). d-e, MA plot of the DEGs (differentially expressed genes) between DT and Ctrl during 8-hour fasting (d) and after 2-hour refeeding (e). Each dot represents one gene. Red dots are the genes with p-values < 0.05 and a log fold change >0.5 or <−0.5. f, Heatmap showing scaled expression (blue, high expression; white, low expression) of representative β-ID genes. The dendrogram represents the clustering of each condition analyzed based on β-ID genes expression. g, Expression levels of key identity (top panel) and functional (bottom panel) β-cell genes during fasting in controls and DT-treated mice after 8-hour fasting or 2-refeeding. P-values for all genes and conditions are non significant (P > 0.05). Only male mice were used. Data are shown as mean ± sd. All statistical tests are two-tailed Mann-Whitney test. Source data is available.

