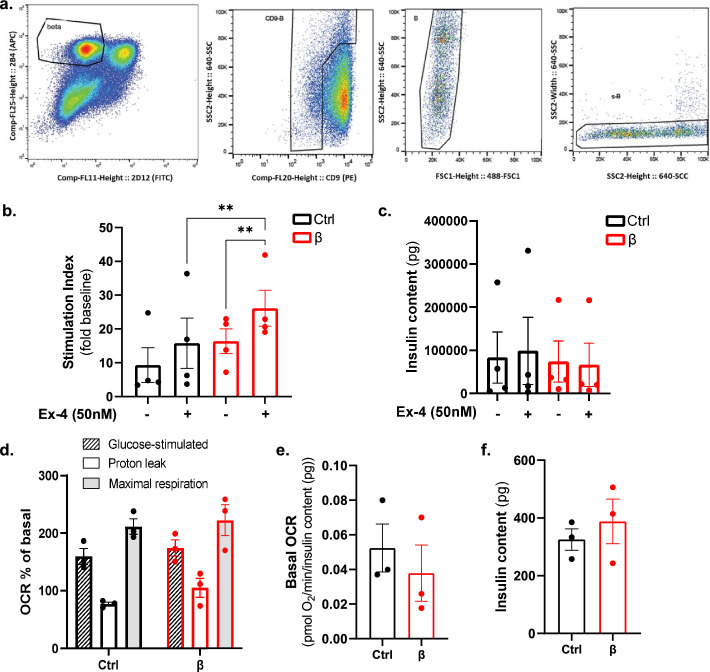
Extended Data Fig. 10. Stimulatory index and glucose-stimulated oxygen consumption are maintained in human monotypic β-pseudoislets.
a. FACS strategy used to purify human β-cells. Representative plots of cells labelled with the pan-endocrine marker HIC1-2B4, the non-β-cell endocrine marker H1C3-2D12 and the δ-cell enriched marker CD9. b. Stimulation index of absolute insulin secretion at 16.7 mM glucose in presence/absence of the GLP-1 agonist Exendin-4 (Ex-4, 50 nM) in pseudoislets composed by all cell types (Ctrl, black) and only β-cells (red). Values are expressed as fold change to baseline values measured at 3 mM glucose (low glucose, LG). N = 4 donors. c. Total insulin content of control (black) and β-only pseudoislets (red) measured after stimulation at 16.7 mM glucose (high glucose, HG). N = 4 donors. P-values (Ctrl vs β): HG P = 0.9708, HG+Ex4 P = 0.4343. P-values Ctrl HG vs HG+Ex4 P = 0.8848. P-values β HG vs HG+Ex4 P = 0.9843. d-f. Pseudoislet respirometry parameters from Fig. 6e. N = 3 independent donors. 2-5 wells/condition/donor, 10 pseudoislets/well. Each data point represents the well average per donor. d. Glucose-stimulated OCR (dashed lined column), proton leak and maximal respiration (grey column) in control (black) and monotypic β-pseudoislets. P-values (Ctrl vs β): Glucose-stimulated OCR P = 0.872; Proton leak P = 0.539; Maximal respiration P = 0.982. (red). e. Basal respiration measured at 3 mM glucose before injections. P-values Ctrl vs β P = 0.4. f. Total insulin content of control (Ctrl) and β-pseudoislets (red) after OCR measurements. P-values Ctrl vs β P = 0.7. Both male and female human donors were used. All data are shown as mean ± sem. All statistical tests are two-tailed Mann-Whitney test. Source data is available.

