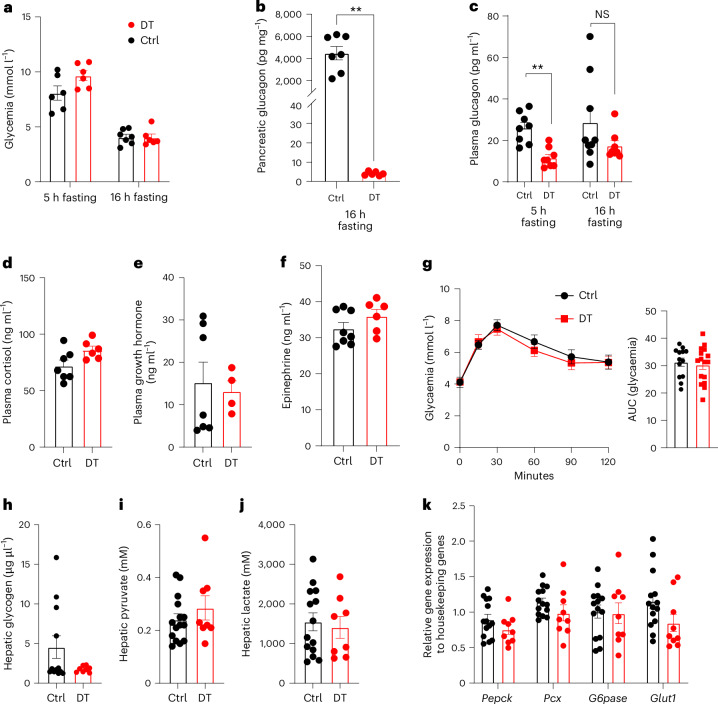
Fig. 3. The ablation of pancreatic α-cells has no effect on GCG-mediated hepatic function.
a, Glycaemia of control (Ctrl) and DT β-only mice after 5 h (Ctrl, n = 6; DT, n = 6) or 16 h (Ctrl, n = 7; DT, n = 6) fasting. P values (DT vs Ctrl): 5 h fasting, P = 0.093; 16 h fasting, P = 0.7587. b, Pancreatic GCG levels of Ctrl (n = 7) and DT (n = 6) β-only mice after 16 h fasting. P values: DT vs Ctrl, **P = 0.0012. c, Plasma GCG levels of Ctrl and DT β-only mice after 5 h (Ctrl, n = 8; DT, n = 8) or 16 h (Ctrl, n = 9; DT, n = 8) fasting. P values: 5 h fasting DT vs Ctrl, **P = 0.0011; 16 h fasting DT vs Ctrl, P = 0.1447. NS, not significant. d–f, Plasma cortisol (Ctrl n = 7; DT n = 6) (d), growth hormone (Ctrl n = 7; DT n = 4) (e) and epinephrine (Ctrl n = 8; DT n = 6) (f) levels of Ctrl and DT after 16 h fasting. P values DT vs Ctrl: cortisol, P = 0.0688; growth hormone, P = 0.7879; epinephrine, P = 0.1074. g, Pyruvate tolerance test (PTT) after 16 h fasting in Ctrl (n = 13) and DT (n = 16) mice. Right panel: AUC of PTT. P values: DT vs Ctrl, P = 0.7136. h–j, Hepatic glycogen (Ctrl n = 12; DT n = 8) (h), pyruvate (Ctrl n = 15; DT n = 8) (i) and lactate (Ctrl n = 14; DT n = 8) (j) levels after 16 h fasting in Ctrl and DT mice. P values DT vs Ctrl: glycogen, P = 0.69; pyruvate, P = 0.579; lactate, P = 0.713. k, Expression of hepatic gluconeogenic enzymes after 16 h fasting in Ctrl (black, n = 14) and DT (red, n = 9) mice. Phosphoenolpyruvate carboxykinase (Pepck), pyruvate carboxylase (Pcx), glucose-6-phosphatase (G6pase) and glucose transporter 1 (Glut1). P values DT vs Ctrl: Pepck, P = 0.2303; Pcx, P = 0.095; G6pase, P = 0.8775; Glut1, P = 0.0534. Only male mice were used. All data are shown as mean ± s.e.m.; P values are from two-tailed Mann–Whitney tests.

