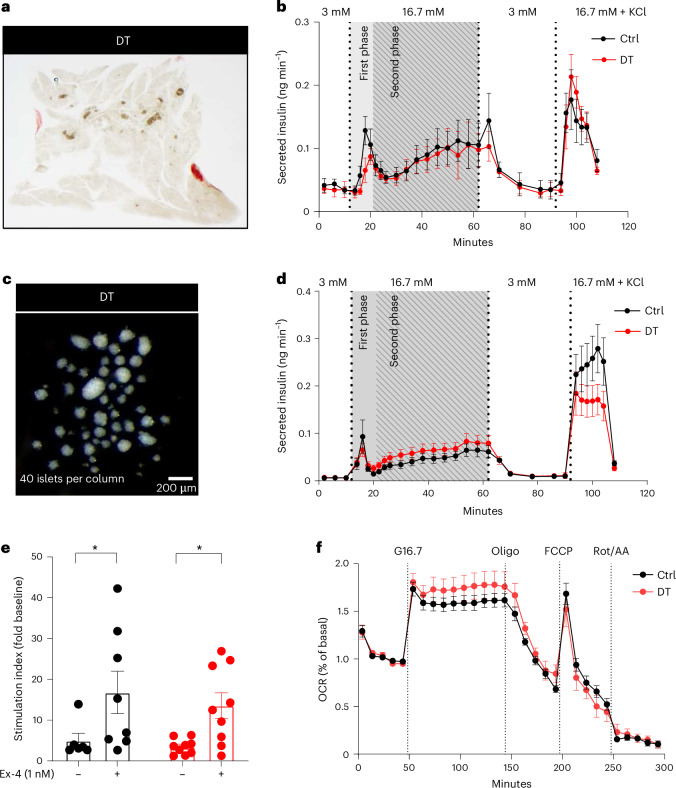
Fig. 5. Monotypic β-only islets have normal dynamic insulin secretion and islet respirometry.
a, Representative picture of a β-only mouse pancreas slice. b, Dynamic insulin secretion profiling on pancreatic slices from Ctrl (n = 5) and DT (n = 3) mice. Gray background area indicates the first and second phase of insulin release. c, Representative picture of isolated islets of β-only mice. d, Dynamic glucose-stimulated insulin secretion profiling on isolated islets. Absolute insulin secretion from Ctrl (n = 9) and DT (n = 8) mice. Gray background area represents the first and second phase of insulin release. e, Stimulation index (as fold change to baseline values) of in vitro glucose-stimulated insulin secretion in isolated islets of Ctrl (black, n = 7) and DT (red, n = 9) mice in the presence or absence of the GLP-1 agonist Ex-4. Low glucose is 3 mM; high glucose is 16.7 mM. P values: Ctrl with vs without Ex-4, *P = 0.048; DT with vs without Ex-4, *P = 0.018. f, Islet respirometry by Seahorse XF96 bioanalyser. Figure shows representative OCR traces of islets from Ctrl (n = 8 mice) and DT (n = 7 mice) sequentially exposed to 16.7 mM glucose (G16.7), 2.5 µM oligomycin (Oligo), 2 µM FCCP and 3 µM Rot/AA at the indicated time points. Basal measurement was performed at 3 mM glucose before injections. OCR was normalized by insulin content of each well and represented as % of basal. Two to four wells per mouse, eight to ten islets per well. Two-way ANOVA with Sidak’s multiple comparisons test. Only male mice were used. All data are shown as mean ± s.e.m. Unless otherwise indicated, P values are from two-tailed Mann–Whitney tests.

