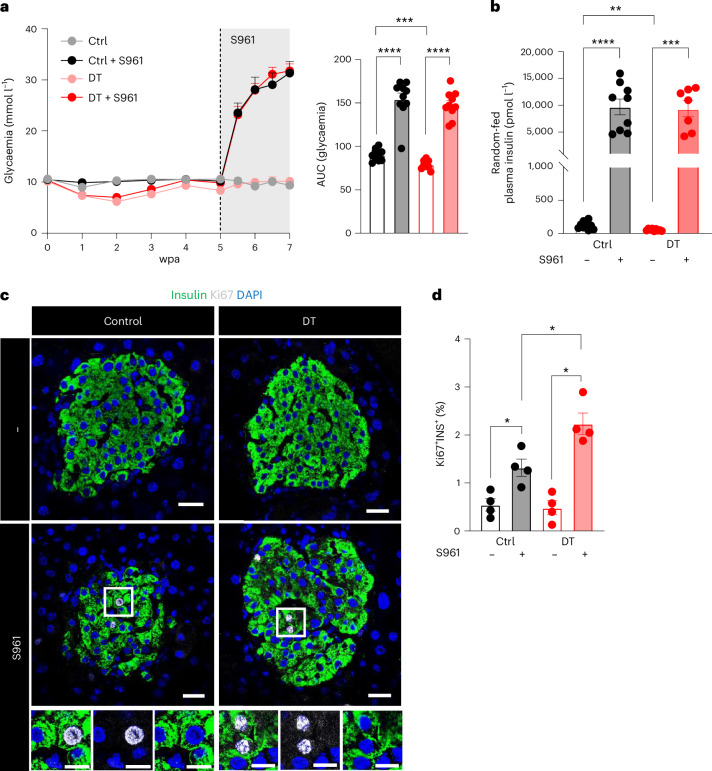
Fig. 6. Monotypic β-only islets have a normal response to extreme insulin demand.
a, Glycaemia before and 2 weeks after S961 treatment on Ctrl (n = 10), Ctrl + S961 (n = 9), DT (n = 9) and DT + S961 (n = 10). Right panel: AUC of glycaemia. P values: Ctrl vs DT, ***P = 0.001; Ctrl vs Ctrl + S961, ****P < 0.0001; DT vs DT + S961, ****P < 0.0001; Ctrl + S961 vs DT + S961, P = 0.1903. b, Plasma insulin release under random-fed conditions in Ctrl (gray, n = 10), Ctrl + S961 (black, n = 9), DT (pink, n = 9) and DT + S961 (red, n = 9). P values: Ctrl vs DT, **P = 0.0015; Ctrl vs Ctrl + S961, ****P < 0.0001; DT vs DT + S961, ***P = 0.0002; Ctrl + S961 vs DT + S961, P = 0.9182. c, Immunofluorescence on pancreatic sections from Ctrl or DT-treated β-only mice with or without S961 treatment. INS, green; Ki67, gray; DAPI, blue. Scale bars, 20 µm. d, Percentage of double-positive INS+KI67+ in INS+ population in Ctrl (n = 4), Ctrl + S961 (n = 4), DT (n = 4) and DT + S961 (n = 4). P values: Ctrl vs DT, P = 0.6857; Ctrl vs Ctrl + S961, *P = 0.286; DT vs DT + S961, *P = 0.286; Ctrl + S961 vs DT + S961, *P = 0.286. Only male mice were used. All data are shown as mean ± s.e.m. P values are from two-tailed Mann–Whitney tests.

