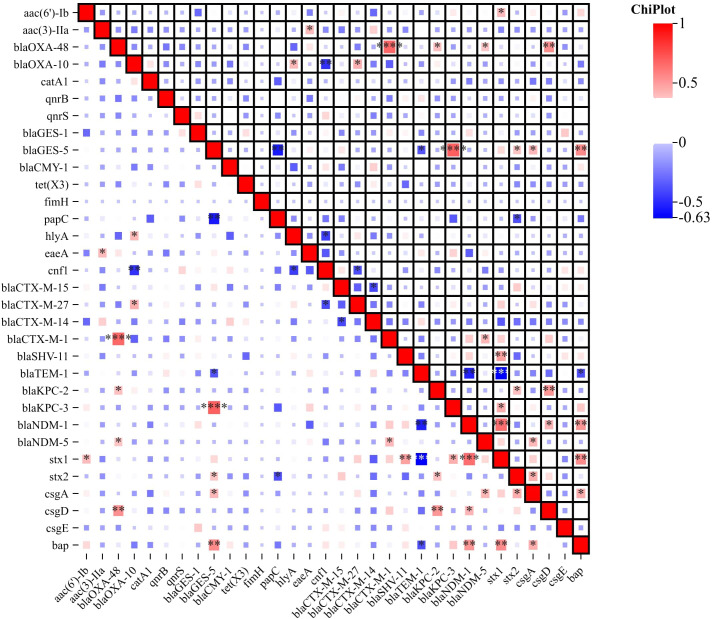
Figure 4.
Correlation Heatmap of Resistance, Virulence, and Biofilm-Associated Genes. The heatmap visually represents the correlation between antibiotic resistance genes, virulence genes and biofilm-associated genes among the ESBL-Producing Cephalosporin-Resistant Escherichia coli ST410. Color intensity and direction indicate the strength and nature of the correlation, respectively. The correlation heatmap was visualized on the image processing website Chiplot (https://www.chiplot.online, accessed on 15 January 2024). Resistance, Virulence, and Biofilm-Associated Genes -Among Correlative degree low, middle and high. *, low, **, middle, ***, high.

