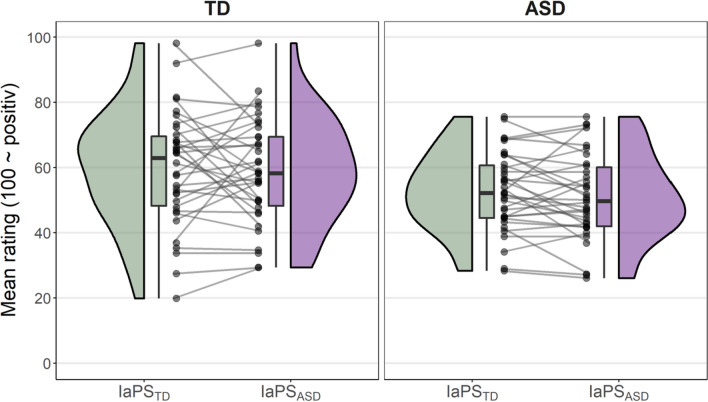
Fig. 5.
Mean post hoc character ratings per observer groups (TD, ASD) and IaPS conditions (IaPSTD, IaPSASD). All character ratings were averaged per subject and IaPS condition. Mean ratings are displayed as clack dots. Connected dots display within-subject difference between IaPS conditions. Ratings were scaled so that “100” displays most positive impressions and “0” displays most negative impressions. Additionally, boxplots and density graphs show distributions of mean ratings in groups (TD left panel; ASD right panel) and IaPS conditions (IaPSTD in green; IaPSASD in purple)

