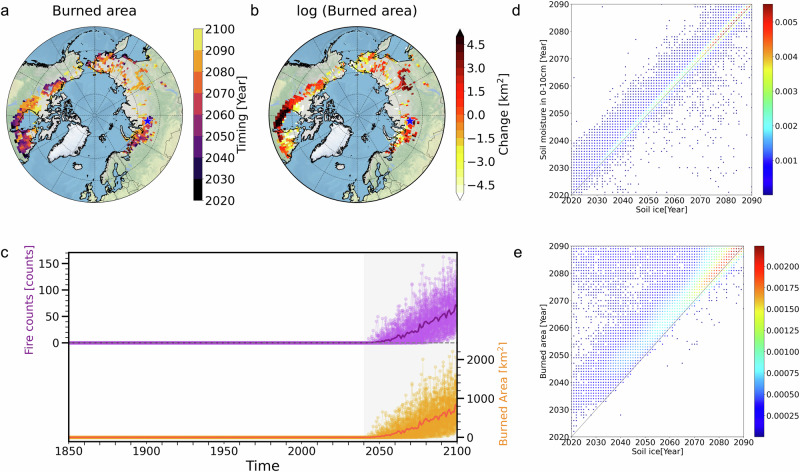
Fig. 4. Abrupt changes in the burned area over the historical permafrost regions.
a The timing of abruptness in the burned area (units: year), (b) the difference in the logarithm of the burned area [log (burned area)] during 20 years of pre- and post-abruptness (units: km2): Blue star markers in panels a, b indicate a representative grid box in western Siberia (65.5°N, 83.75°E), (c) temporal evolution of fire counts (units: counts) and burned area (units: km2) over a representative grid box in western Siberia (65.5°N, 83.75°E). Bold lines indicate the ensemble mean and thin lines indicate individual ensemble members in panel c. d, e Relationship between the timing of permafrost thaw and abrupt changes in soil moisture and burned area over the historical permafrost regions (units: year): (d) soil ice content and soil moisture in 0–10 cm depth, and (e) soil ice content and burned area in the 50 ensemble members (units: year). Red indicates a higher probability density of grid points and blue a lower probability density in panels d, e.

