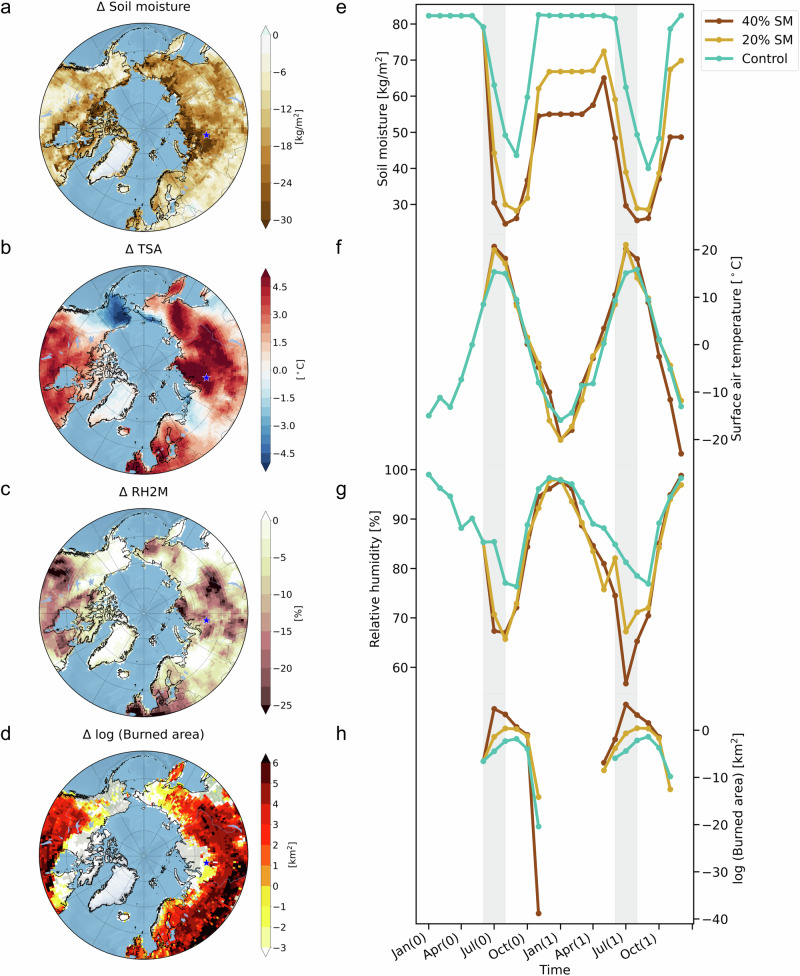
Fig. 5. Atmospheric and wildfire responses to soil moisture reduction in the idealized experiments using the CESM2.
The values represent differences between the response of a 40% soil moisture reduction perturbation experiment in July 2045 and a control simulation: (a) soil moisture in 0–10 cm depth (units: kg/m2), (b) surface air temperature (units: °C), (c) relative humidity at 2 m (units: %), and (d) logarithm of burned area [log (burned area)] (units: km2). Time evolution over Western Siberia (65.5°N, 83.75°E): (e) soil moisture over 0–10 cm depth (units: kg/m2), (f) surface air temperature (units: °C), (g) relative humidity at 2 m (units: %), and (h) logarithm of the burned area [log (burned area)] (units: km2) (blue: control simulation, yellow: 20% soil moisture reduction perturbation experiment, and brown: 40% soil moisture reduction perturbation experiment).

