Figure 3.
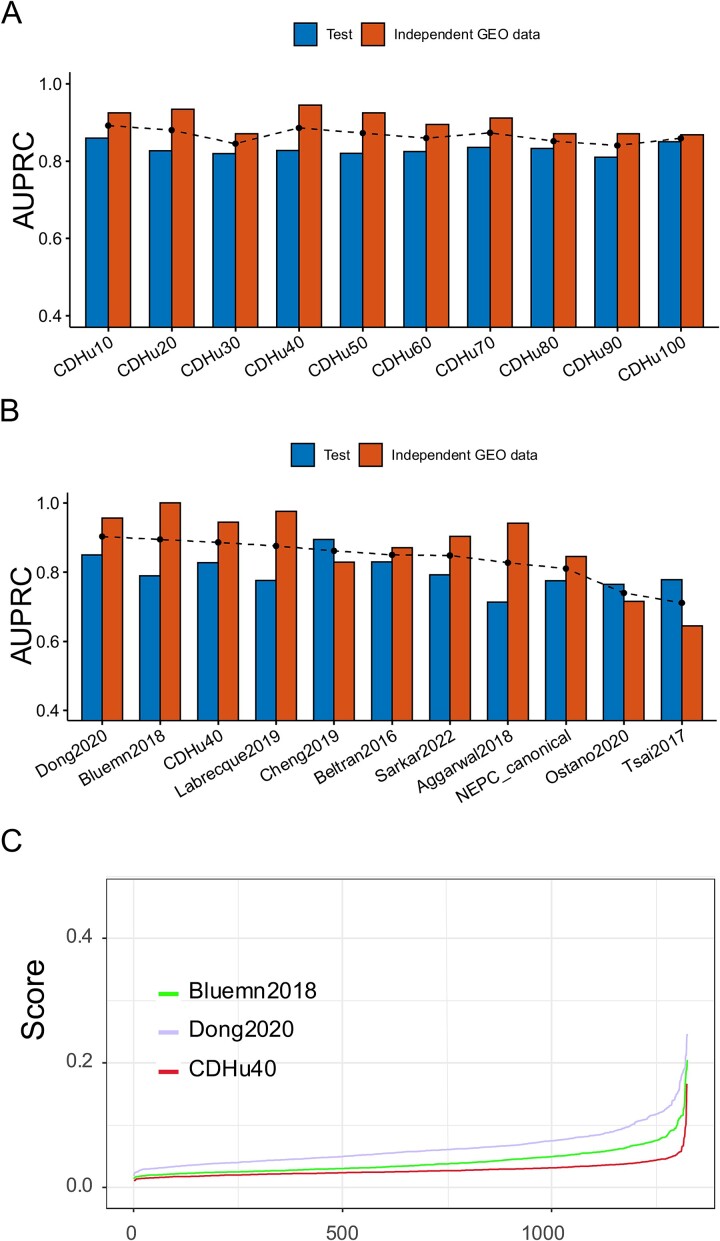
Performance of CDHu40 and other published NEPC marker gene sets. (A) AUPRC for top uKIN genes from 10 (CDHu10) up to 100 (CDHu100), where the dashed dot line is average values of AUPRC for two datasets. (B) Bar plot of AUPRC scores for each gene set. Gene sets were sorted by the average values (dashed dot line) of AUPRC. (C) NEPC scores of PRAD-TCGA samples estimated by Bluemn2018, Dong2020, and CDHu40, respectively.

