Figure 5.
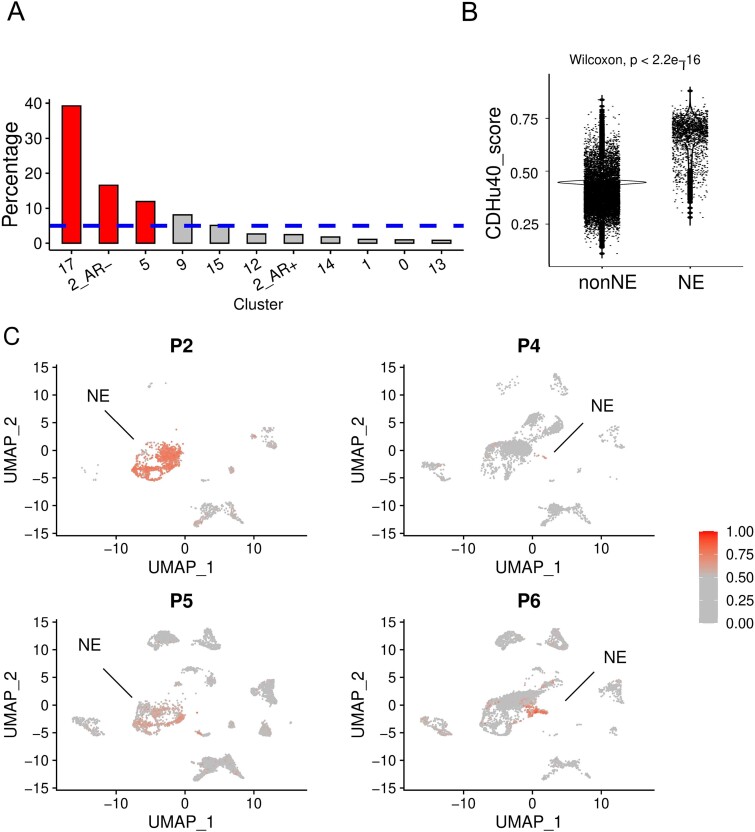
Association between CDHu40 score and NEPC cells from scRNA-seq datasets. (A) Percentage of cells with higher CDHu40 scores in each cluster recognized by Asberry et al. [19] at Day 14 after NED. The bars represent the significantly (P < .05) higher ratio, whereas the dashed line is the average percentage of high-CDHu40 score in all cells in the sample. (B) CDHu40 scores for NE cells and non-NE cells. (C) Cells with higher CDHu40 scores were marked given the patient samples with the scRNA-seq by Dong et al. [20].

