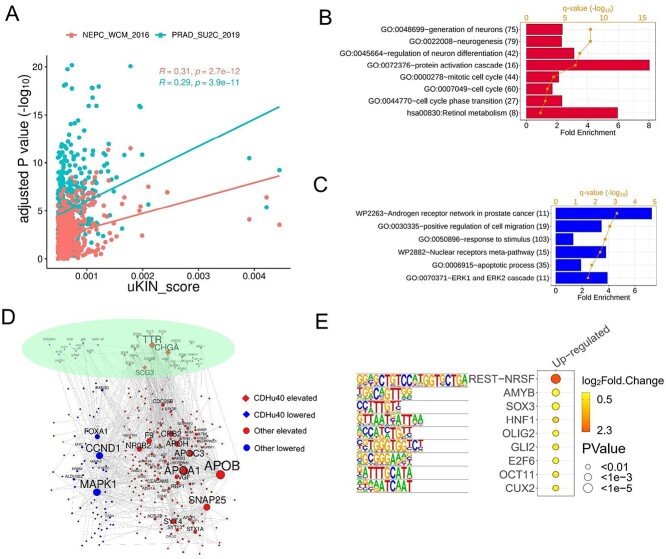
Figure 7.
Top 500 genes identified by our methods. (A) Correlation between uKIN scores of top 500 gene and corresponding adjusted P-values (−log10) determined by differential analysis on two datasets, NEPC_WCM_2016 and PRAD_SU2C_2019, respectively. Gene ontology and Kyoto Encyclopedia of Genes and Genomes (KEGG) pathway enriched in (B) up-regulated genes and (C) down-regulated genes. (D) PPI network of top 500 genes including. CDHu40 maerker genes and other genes with elevated and lower expression levels, respectively, in NEPC samples. (E) Motifs enriched in the regions from upstream (2 kb) to downstream (500 bp) of 330 up-regulated candidate genes.

