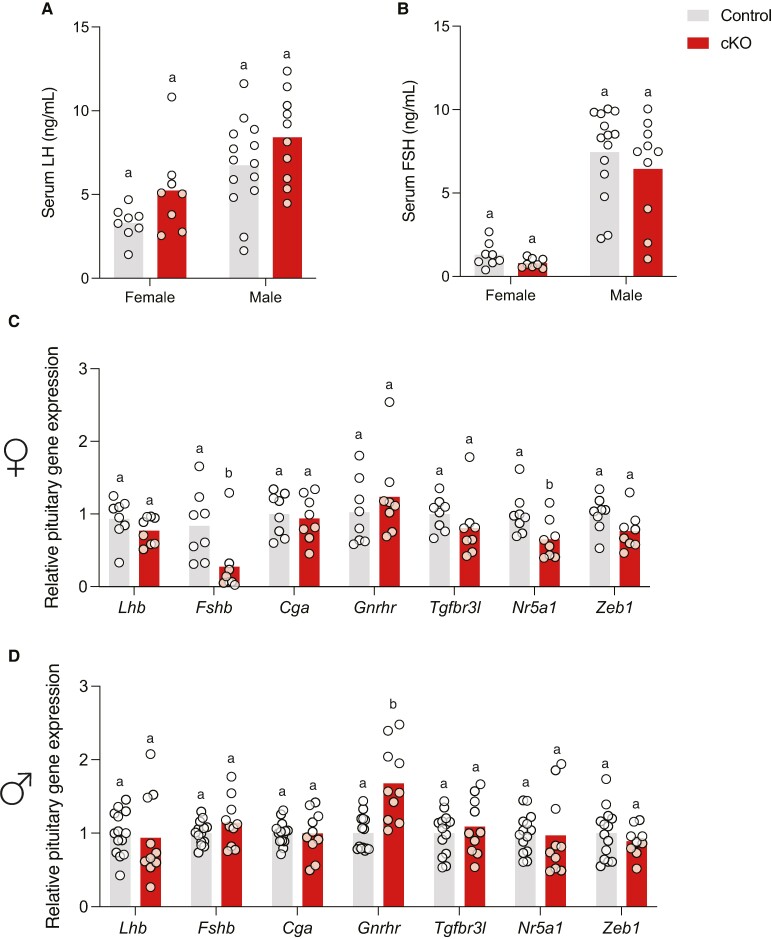
Figure 5.
Normal gonadotropin production in Zeb1 conditional knockout mice. Serum (A) LH and (B) FSH levels in female and male control and cKO mice. Pituitary gene expression in (C) female and (D) male control and cKO mice. Bar heights are group means. Each white circle represents an individual mouse. Data were analyzed by two-tailed unpaired t tests with Welch's correlation. Bars with different letters differ significantly.

