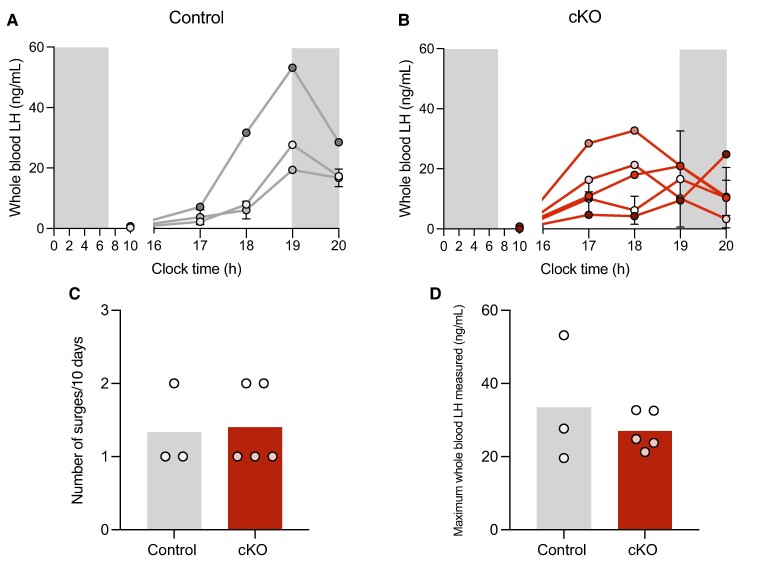
Figure 6.
Normal preovulatory LH surges in cKO females. Profiles of the LH secretion obtained on proestrus from 3 control (A) and 5 cKO (B) females that exhibited LH surges. Different-colored circles and lines indicate different mice. Gray areas represent the dark phase of the light/dark cycle. For mice that surged more than once in the sampling period, their whole-blood LH levels are represented as the mean ± standard error of the mean [SEM]. (C) Number of surges observed in each mouse during the sampling period. (D) Maximal whole-blood LH levels (ng/mL) measured in each mouse. White circles in (C) and (D) represent individual mice. Data represent the subset of females that had 1 ≥ LH surge in the sampling period.

