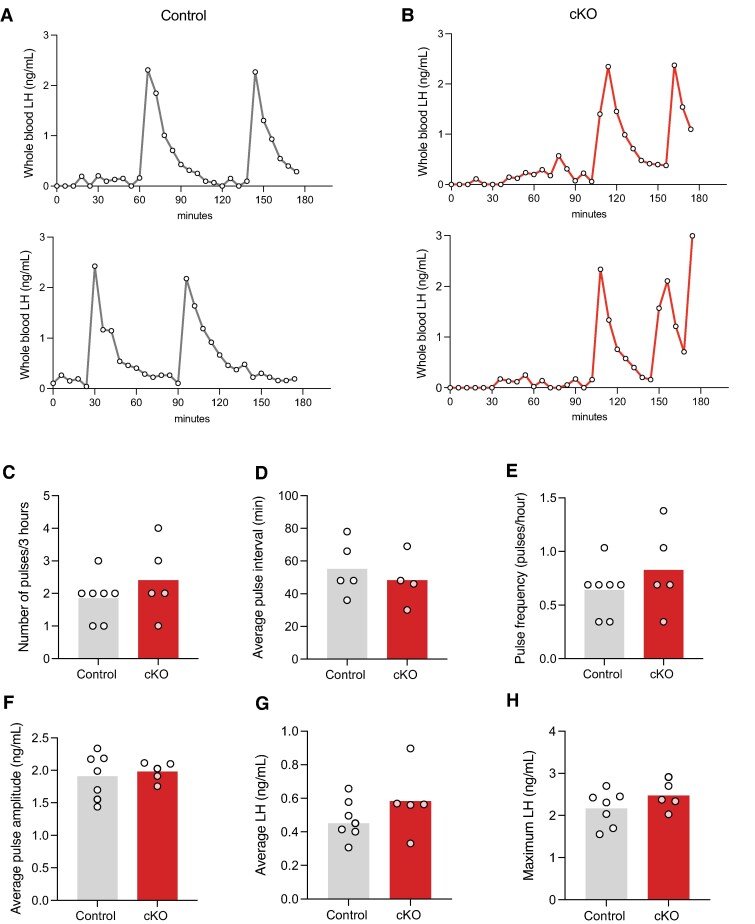
Figure 7.
Normal LH pulses in cKO males. Profiles of LH secretion from (A) 2 control (gray) and (B) 2 cKO (red) males. Quantification of the (C) number of pulses, (D) pulse interval, (E) pulse frequency, (F) average pulse amplitude (ng/mL), (G) average LH (ng/mL), and (H) maximum LH (ng/mL) in the sampling period. Bar heights are group means. Each white circle represents an individual mouse. Data represent the subset of males that exhibited 1≥ LH pulse (as determined by PULSAR analysis) in the sampling period.

