. 2024 Sep 18;12(21):5582–5597. doi: 10.1039/d4bm00910j

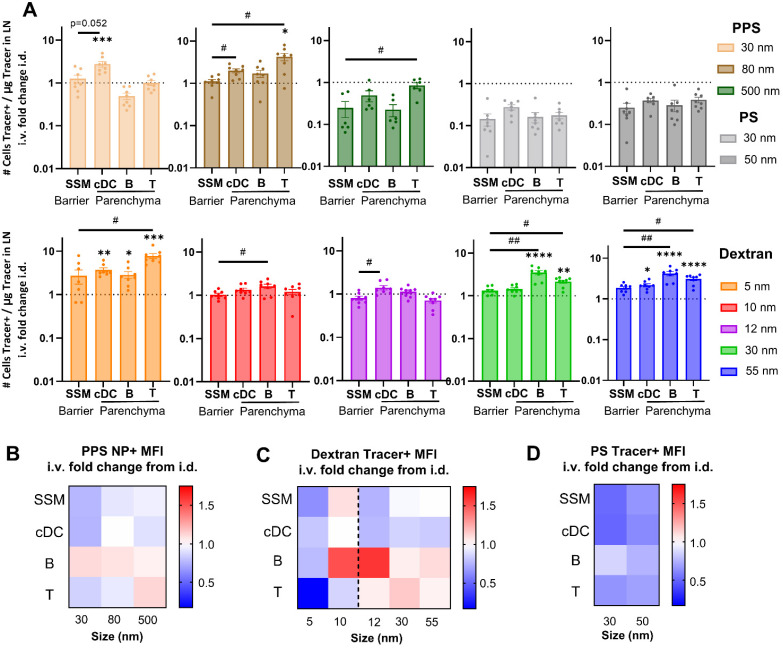
Fig. 5. Quantity of tracer association with LN leukocyte subtypes differs between i.v. relative to i.d. routes of administration. (A) Number of cells associated with tracer per microgram of tracer delivered to the lymph node from i.v. administration fold change relative to i.d. administration. *, **, ***, **** indicate significant difference in delivery between i.v. and i.d. administration (p < 0.05, p < 0.01, p < 0.001, p < 0.0001, respectively), whereas # and ## indicate significant difference between cell types (p < 0.05, p < 0.01, respectively) by one-way ANOVA. Heat map of (B) dextran tracer+ MFI, (C) PPS NP+ MFI, and (D) polystyrene tracer+ MFI in major leukocyte subsets from i.v. relative to i.d. administration. Dashed line in (C) represents the size cut-off of the subcapsular sinus and conduit entry in the LN parenchyma. n = 5 mice per group and results are representative of two independent experiments.

Fig. 5