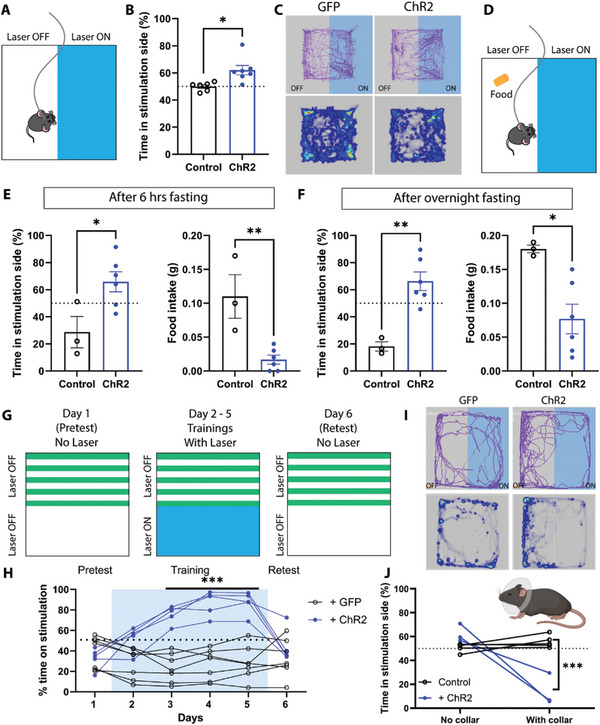
Figure 3.

Optogenetic activation of ZITH neurons induces real‐time place preference (RTPP). A) Schematic diagram of real‐time place preference strategy; B) histogram of RTPP (control: N = 6 mice, ChR2: N = 7 mice, p = 0.011, two‐tailed unpaired Student's t‐test); C) representative animal trace tracks (top) and heatmap of time spent (bottom) in the arena from a GFP‐injected animal (left panels), and a ChR2‐injected animal (right panels); D) diagram of the experimental setup for RTPP paired with food; E) summary histograms of time spent on the stimulation side and the amount of food consumed during tests after 6 h food deprivation (control N = 7 mice, ChR2: N = 9 mice, p = 0.0005 and p = 0.018, respectively, two‐tailed unpaired Student's t‐test); F) summary histograms of time spent on the stimulation side and the amount of food consumed during tests after overnight food deprivation (control N = 6 mice, ChR2: N = 9 mice, p < 0.0001 and p = 0.0005, respectively, two‐tailed unpaired Student's t‐test); G) illustrations of the experimental setup for conditioned place preference (CPP); H) summary of time spent on the stimulation side during CPP tests (control N = 7 mice, ChR2: N = 5 mice, p < 0.001 on days 3–5, repeated measurements two‐way ANOVA). I) representative animal trace tracks (top) and heatmap of time spent (bottom) in the arena from a GFP‐injected animal (left panels), and a ChR2‐injected animal (right panels) with collar to prevent grooming; J) summary histogram of time spent on the stimulation side without and with Elizabethan collar (control N = 5 mice, ChR2: N = 3 mice, no collar p = 0.049, with collar p < 0.0001, repeated measurements two‐way ANOVA). Each circle represents an individual mouse. *p < 0.05; **p < 0.01.
