
Figure 4.
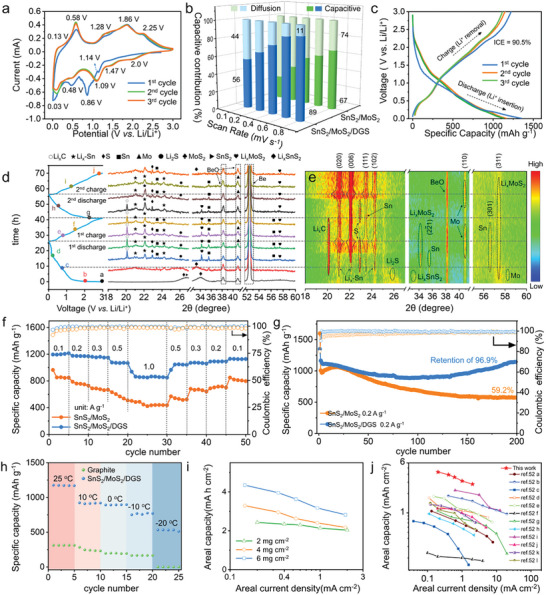
Electrochemical performance of SnS2/MoS2/DGS electrodes: a) CV curves of the first three cycles at a rate of 0.1 mV s−1. b) Comparison of the proportions of the capacitive and diffusive contributions. c) Galvanostatic discharge/charge profiles of the SnS2/MoS2/DGS electrode at 0.2 A g−1 during the first three cycles. d) In situ XRD at different discharge (D)/charge (C) depths (color online), and e) corresponding a contour plot during the initial two cycles. f) Rate performance and g) cycling performance at 0.2 A g−1. The active material loading is ≈2 mg cm−2. h) Discharged capacities of the SnS2/MoS2/DGS and graphite electrodes at 0.2 A g−1 and temperatures ranging from 25 to −20 °C. i) Areal capacity versus areal current density of SnS2/MoS2/DGS electrodes with mass loadings of 2, 4, and 6 mg cm−2. j) Comparison of the areal capacity of SnS2/MoS2/DGS anodes with that of representative anodes reported at different rates, including anodes from graphite, Sn‐based composites, heterojunction composites, and Si‐based composites.