Figure 1.

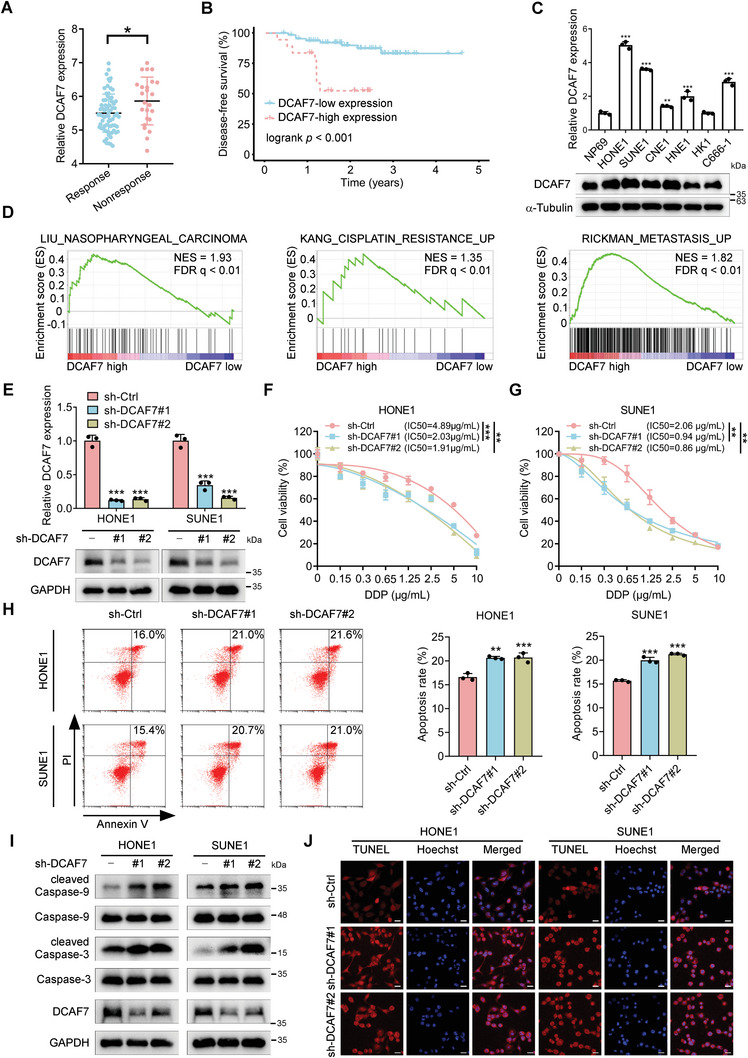
DCAF7 is associated with chemoresistance and indicates a poor prognosis. A) mRNA expression levels of DCAF7 in NPC patients who received TPF chemotherapy, based on the GSE132112 dataset. Student's t‐test, * p < 0.05. B) Kaplan–Meier survival analysis of patients with NPC in the GSE102349 dataset (n = 88) stratified by DCAF7 expression (high vs low). C) RT‒qPCR and western blot analysis results showing the mRNA and protein expression levels, respectively, of DCAF7 in NPC and NP69 cells. Mean (n = 3) ± s.d. One‐way ANOVA, ** p < 0.01, *** p < 0.001. D) GSEA of the GSE102349 dataset revealed positive enrichment of genes associated with NPC, cisplatin resistance and metastasis signatures in response to high DCAF7 expression. E) The DCAF7 knockdown efficiency was assessed using RT‒qPCR and western blotting. Mean (n = 3) ± s.d. One‐way ANOVA, *** p < 0.001. F,G) A CCK‐8 assay was used to evaluate cisplatin resistance in transfected NPC cells following treatment with the indicated concentrations of cisplatin for 48 h. Mean (n = 4) ± s.d. Two‐way ANOVA, ** p < 0.01, *** p < 0.001. H) NPC cells were exposed to cisplatin (2.5 µg mL−1) for 24 h, and cisplatin‐induced apoptosis was measured via Annexin‐V/PI staining and flow cytometry. Mean (n = 3) ± s.d. One‐way ANOVA, ** p < 0.01, *** p < 0.001. I) NPC cells were treated with cisplatin (10 µg mL−1) for 24 h. The levels of apoptosis‐related proteins, including Caspase3/9 and cleaved Caspase3/9, were measured via western blotting. J) NPC cells were treated with cisplatin (10 µg mL−1) for 24 h, and cisplatin‐induced apoptosis was detected using a TUNEL assay. Scale bars = 20 µm. The unprocessed images of the blots are shown in Figure S10 (Supporting Information).
