
Figure 1.
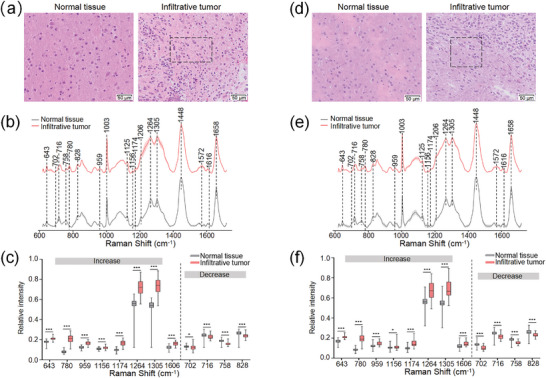
Comparison of normal brain tissues and infiltrating lesions in (a‐c) GL261 and (d‐f) LN229 tumor‐bearing mice (n = 16 per animal model). a,d) The H&E images of normal brain tissues and infiltrative tumors. The black boxes are the infiltrative areas. b,e) The average Raman spectra of normal brain tissues and infiltrative tumors (n = 64 per group). The shaded areas represent the standard deviations. c,f) Raman peaks that either increase or decrease in infiltrative tumors relative to normal brain tissues (n = 64 per group). The Raman peak intensities of 959, 1156, 1174, 1606, and 702 cm−1 in GL261 tumor‐bearing mice (c) were analyzed using the unpaired t‐tests, and other Raman peak intensities (c,f) were analyzed by the Mann‐Whitney test, *P < 0.05, **P < 0.01, ***P < 0.001.